

CLARITY-BPA: Effects of Chronic Bisphenol A Exposure on the Immune System: Part 2 – Characterization of Lymphoproliferative and Immune Effector Responses by Splenic Leukocytes
Jinpeng Li, Anthony Bach, Robert B. Crawford, Ashwini S. Phadnis-Moghe, Weimin Chen, Shawna D’Ingillo, Natalia Kovalova, Jose E. Suarez-Martinez, Jiajun Zhou, Barbara L. F. Kaplan, and Norbert E. Kaminski.
Toxicology (2018)
DOI: https://doi.org/10.1016/j.tox.2018.02.004
PMID: 29427786
Publication
Abstract
Bisphenol A (BPA) is commonly used in the manufacturing of a wide range of consumer products, including polycarbonate plastics, epoxy resin that lines beverage and food cans, and some dental sealants. Consumption of food and beverages containing BPA represents the primary route of human BPA exposure, which is virtually ubiquitous. An increasing number of studies have evaluated the effects of BPA on immune responses in laboratory animals that have reported a variety of effects some of which have been contradictory. To address the divergent findings surrounding BPA exposure, a comprehensive chronic treatment study of BPA was conducted in Sprague-Dawley rats, termed the Consortium Linking Academic and Regulatory Insights on Toxicity of BPA (CLARITY-BPA). As a participant in the CLARITY-BPA project, our studies evaluated the effects of BPA on a broad range of immune function endpoints using spleen cells isolated from BPA or vehicle treated rats. This comprehensive assessment included measurements of lymphoproliferation in response to mitogenic stimuli, immunoglobulin production by B cells, and cellular activation of T cells, NK cells, monocytes, granulocytes, macrophages and dendritic cells. In total, 630 different measurements in BPA treated rats were performed of which 35 measurements were statistically different from vehicle controls. The most substantive alteration associated with BPA treatment was the augmentation of lymphoproliferation in response to pokeweed mitogen stimulations in 1 year old male rats, which was also observed in the reference estrogen ethinyl estradiol treated groups. With the exception of the aforementioned, the statistically significant changes associated with BPA treatment were mostly sporadic and not dose-dependent with only one out of five BPA dose groups showing a statistical difference. In addition, the observed BPA-associated alterations were mostly moderate in magnitude and showed no persistent trend over the one-year time period. Based on these findings, we conclude that the observed BPA-mediated changes observed in this study are unlikely to alter immune competence in adult rats.
Figures
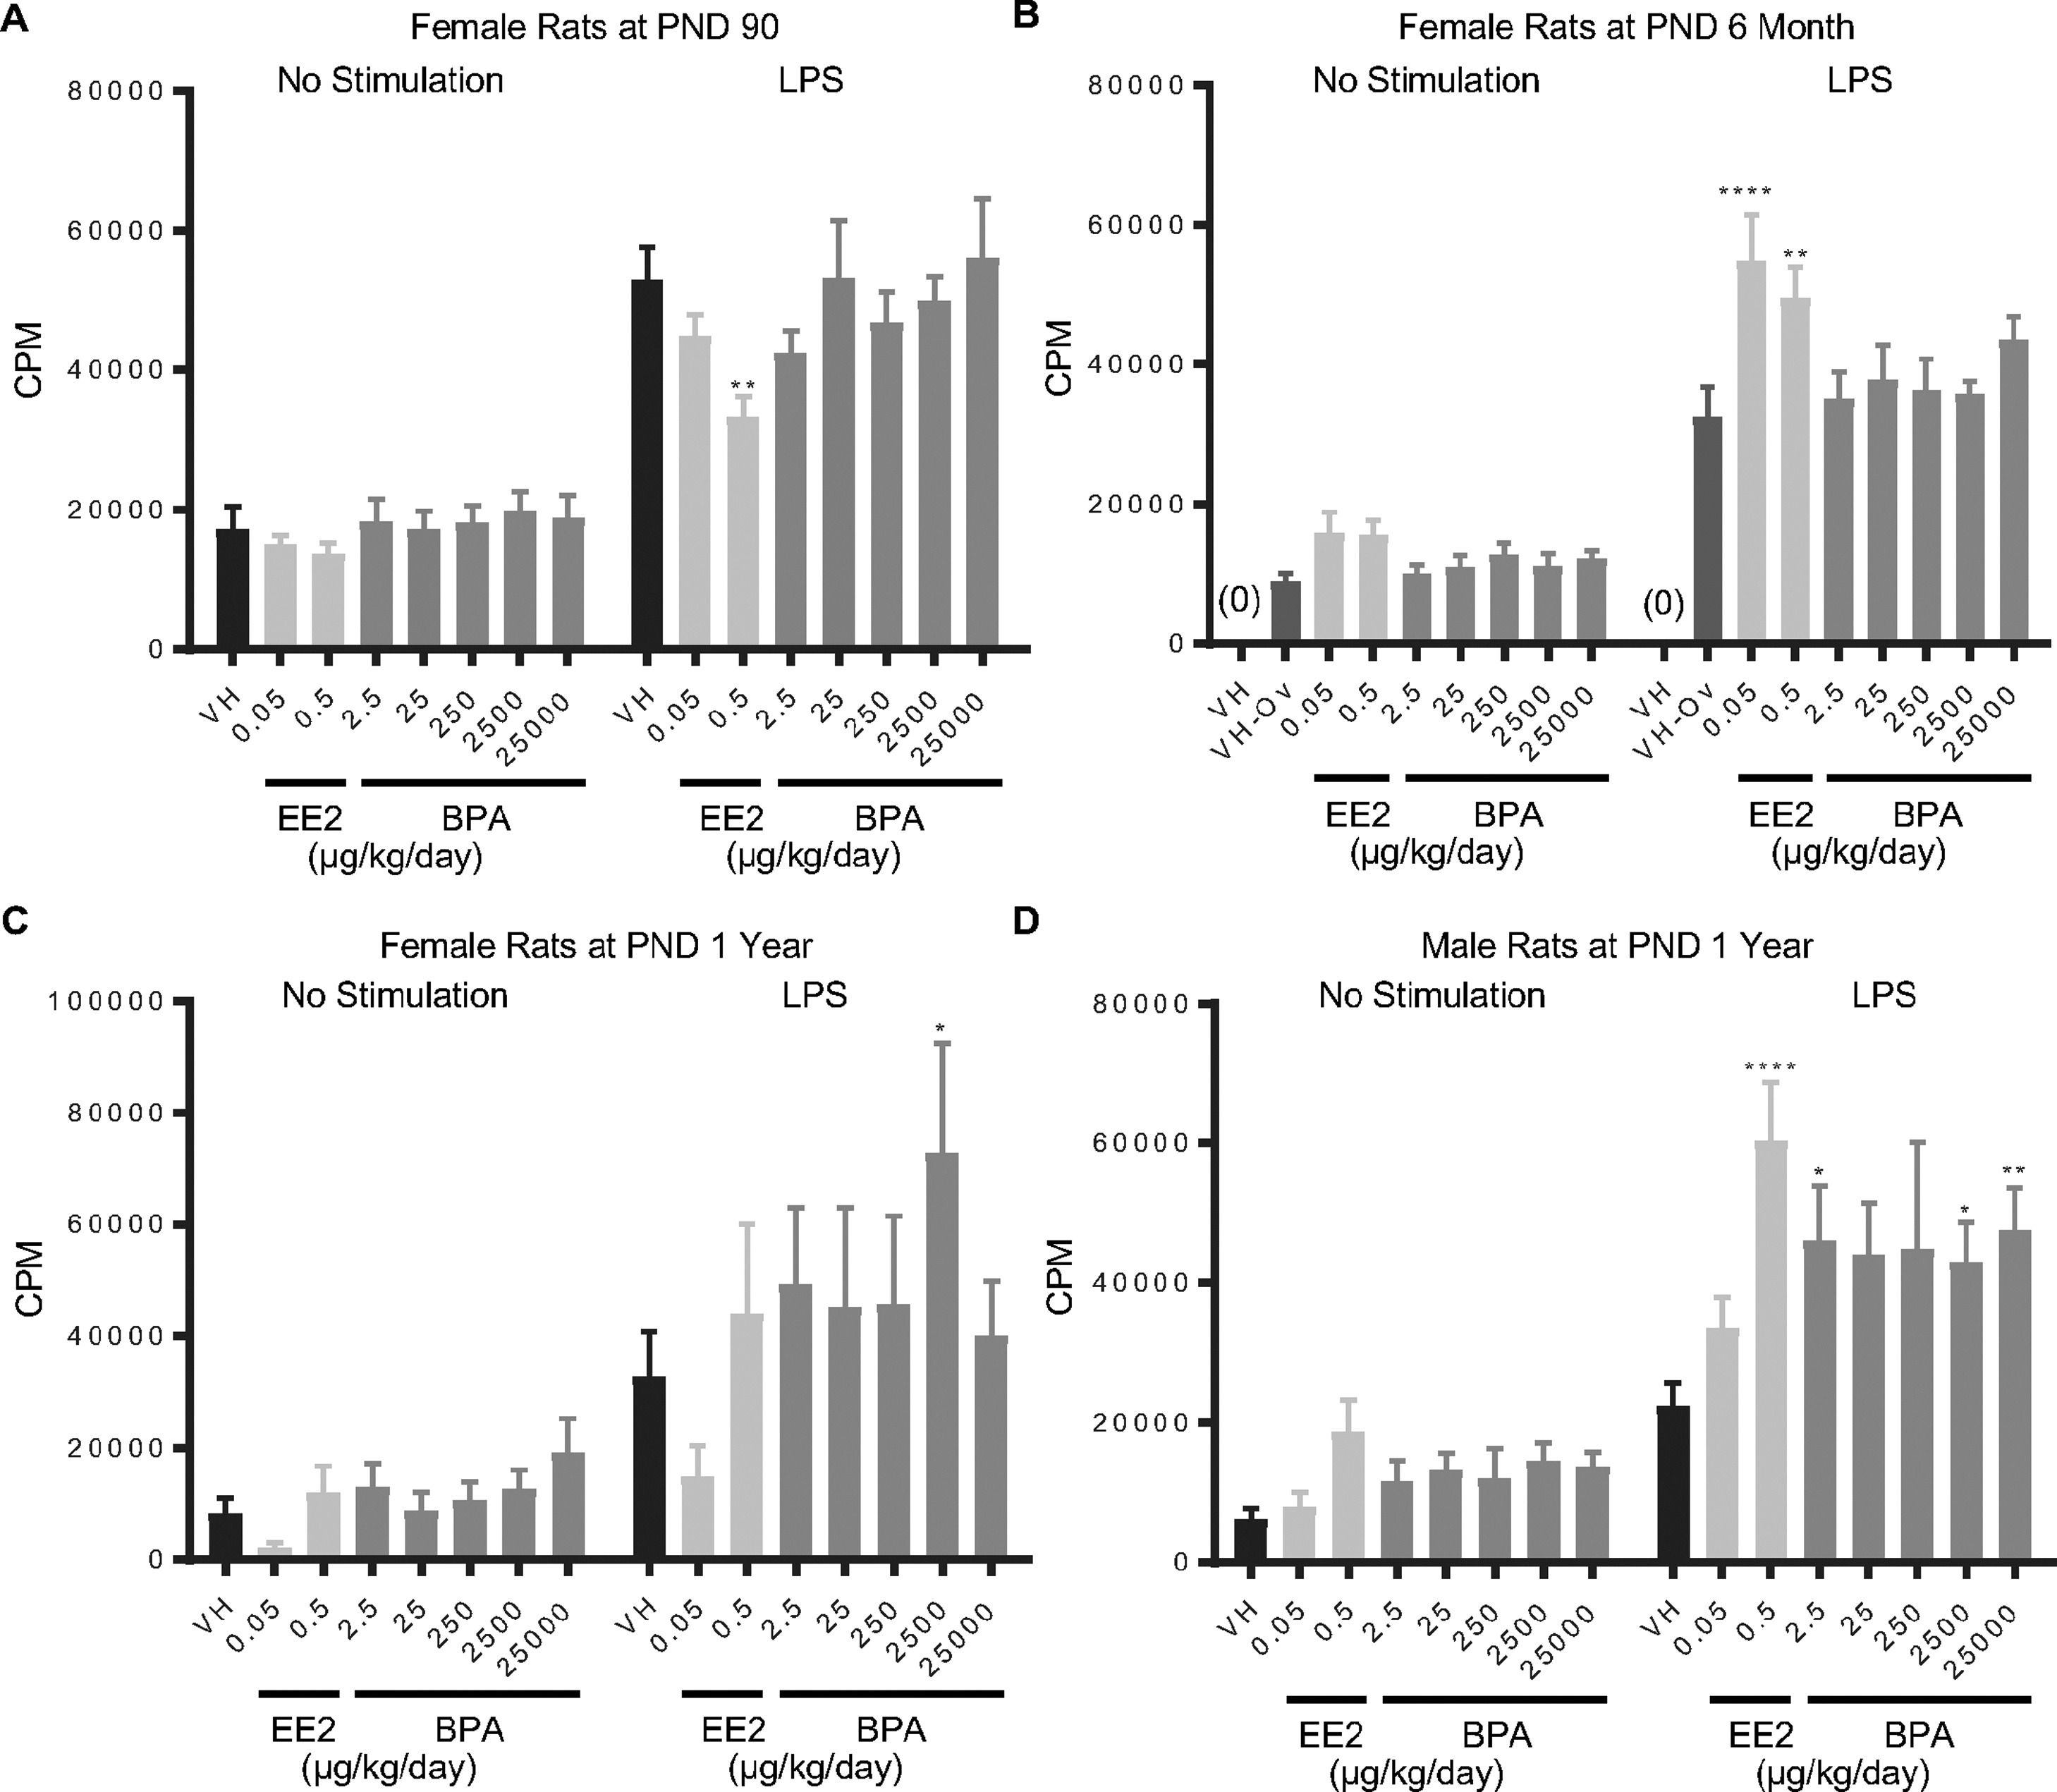
Figure 1. Quantification of LPS-induced spleen cell proliferation by treatment group and sex.
Female (A, B, C) and male (D) rats were administered vehicle (VH, 0.3% aqueous carboxymethylcellulose), BPA or estrogen ethinyl estradiol (EE2) at the indicated dose level by oral gavage daily and sacrificed at postnatal day (PND) 90 (A), 6 month (B), and 1 year (C, D). Splenocytes were isolated and treated with LPS for 48 h followed by a 24 h pulse with [3H]-thymidine. Cells were harvested and quantified for [3H]-thymidine incorporation using a Tri-Carb 2100 TR scintillation counter, which is represented as counts per minute (CPM).
Results are presented as mean ± SE. n = 6–10 rats/treatment group/sex.
* p < 0.05, ** p < 0.01, **** p < 0.0001 when compared to respective vehicle control (VH-Ov for female rats at PND 6 month) by a two way ANOVA with Dunnett’s posttest. For more details about VH-Ov, please see the Statistical Analysis section in the Materials and Methods.
- Figure 1 (572 KB)
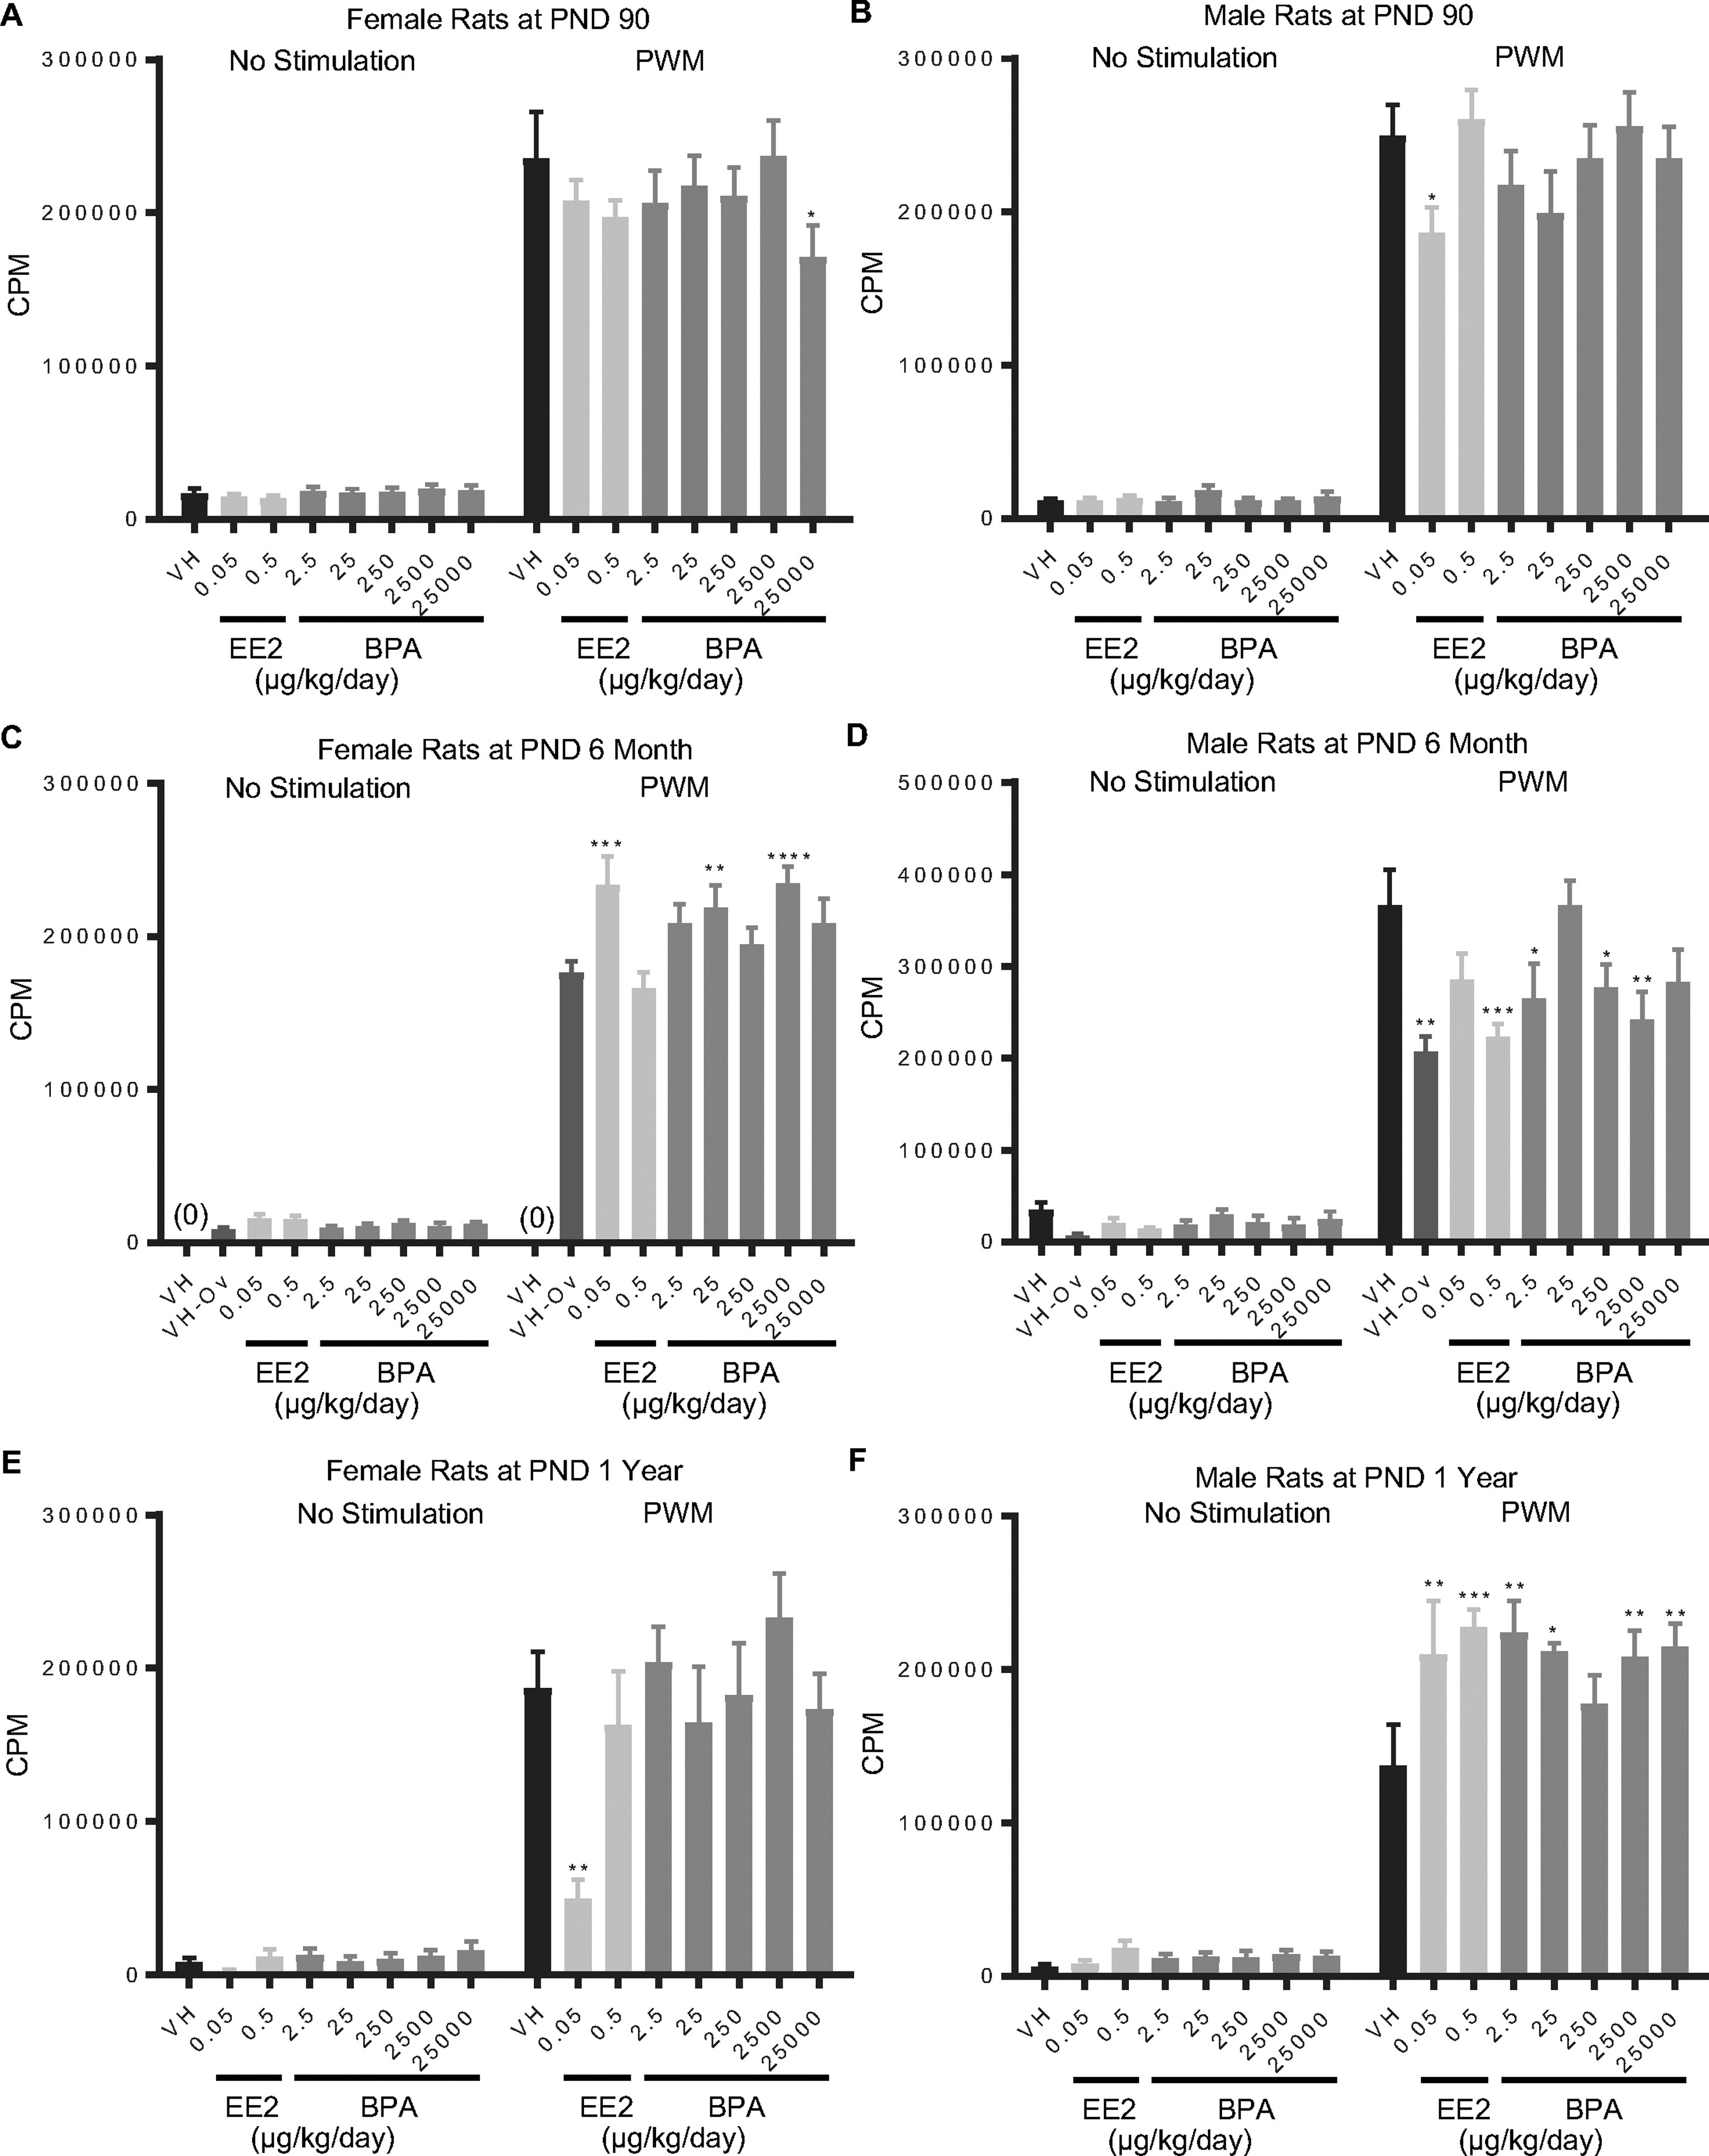
Figure 2. Quantification of pokeweed mitogen (PWM)-induced splenocyte proliferation by treatment group and sex.
Female (A, C, E) and male (B, D, F) rats were administered vehicle (VH, 0.3% aqueous carboxymethylcellulose), BPA or estrogen ethinyl estradiol (EE2) at the indicated dose level by oral gavage daily and sacrificed at postnatal day (PND) 90 (A, B), 6 month (C, D), and 1 year (E, F). Splenocytes were isolated and treated with PWM for 48 h followed by a 24 h pulse with [3H]-thymidine. Cells were harvested and quantified for [3H]-thymidine incorporation using a Tri-Carb 2100 TR scintillation counter, which is represented as counts per minute (CPM).
Results are presented as mean ± SE. n = 2–10 rats/treatment group/sex, n = 2 rats in PND 1 year 250 μg BPA/kg/day treated male group. * p < 0.05, ** p < 0.01, *** p < 0.001, **** p < 0.0001 when compared to respective vehicle control (VH-Ov for female rats at PND 6 month) by a two way ANOVA with Dunnett’s posttest. For more details about VH-Ov, please see the Statistical Analysis section in the Materials and Methods.
- Figure 2 (825 KB)
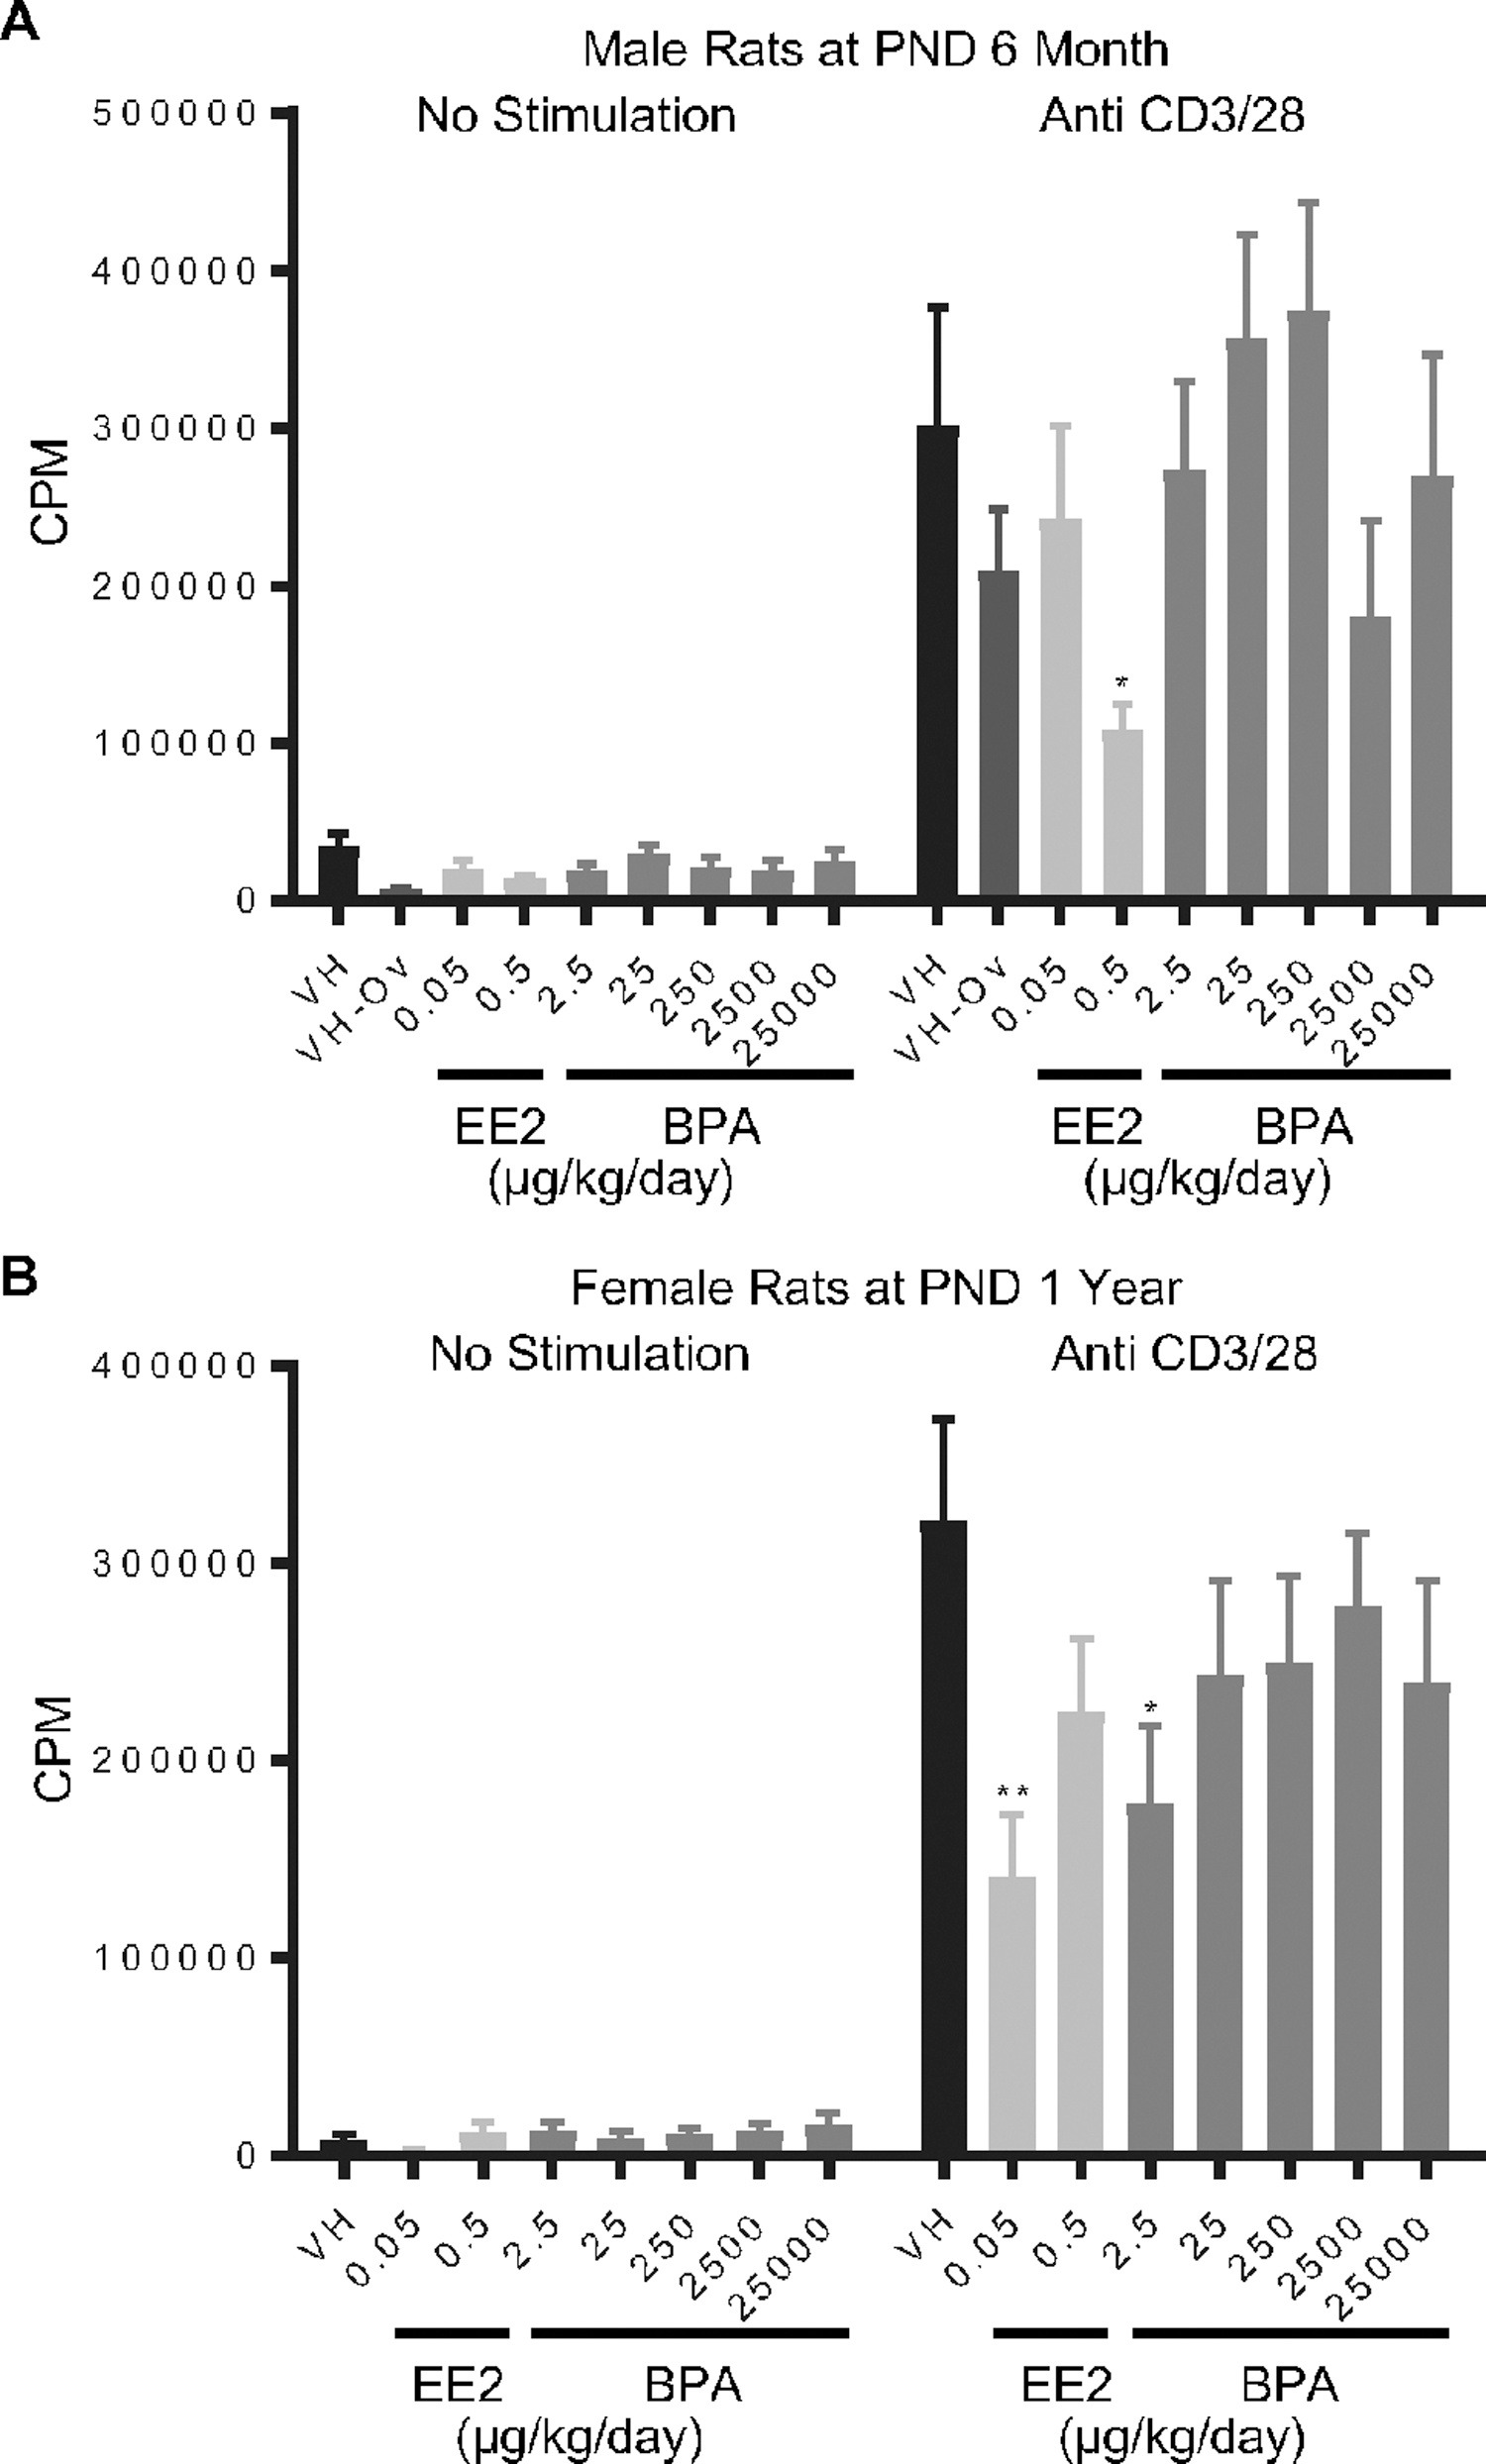
Figure 3. Quantification of anti-CD3/28-induced splenocyte proliferation of rats by treatment group and sex.
Male (A) and female (B) rats were administered vehicle (VH, 0.3% aqueous carboxymethylcellulose), BPA or estrogen ethinyl estradiol (EE2) at the indicated dose level by oral gavage daily and sacrificed at postnatal day (PND) 6 month (A) and 1 year (B). Splenocytes were isolated and treated with anti-CD3/CD28 for 48 h followed by a 24 h pulse with [3H]-thymidine. Cells were harvested and quantified for [3H]-thymidine incorporation using a Tri-Carb 2100 TR scintillation counter, which is represented as counts per minute (CPM).
Results are presented as mean ± SE. n = 4–10 rats/treatment group/sex. * p < 0.05, ** p < 0.01 when compared to respective vehicle control by a two way ANOVA with Dunnett’s posttest. For more details about VH-Ov, please see the Statistical Analysis section in the Materials and Methods.
- Figure 3 (298 KB)
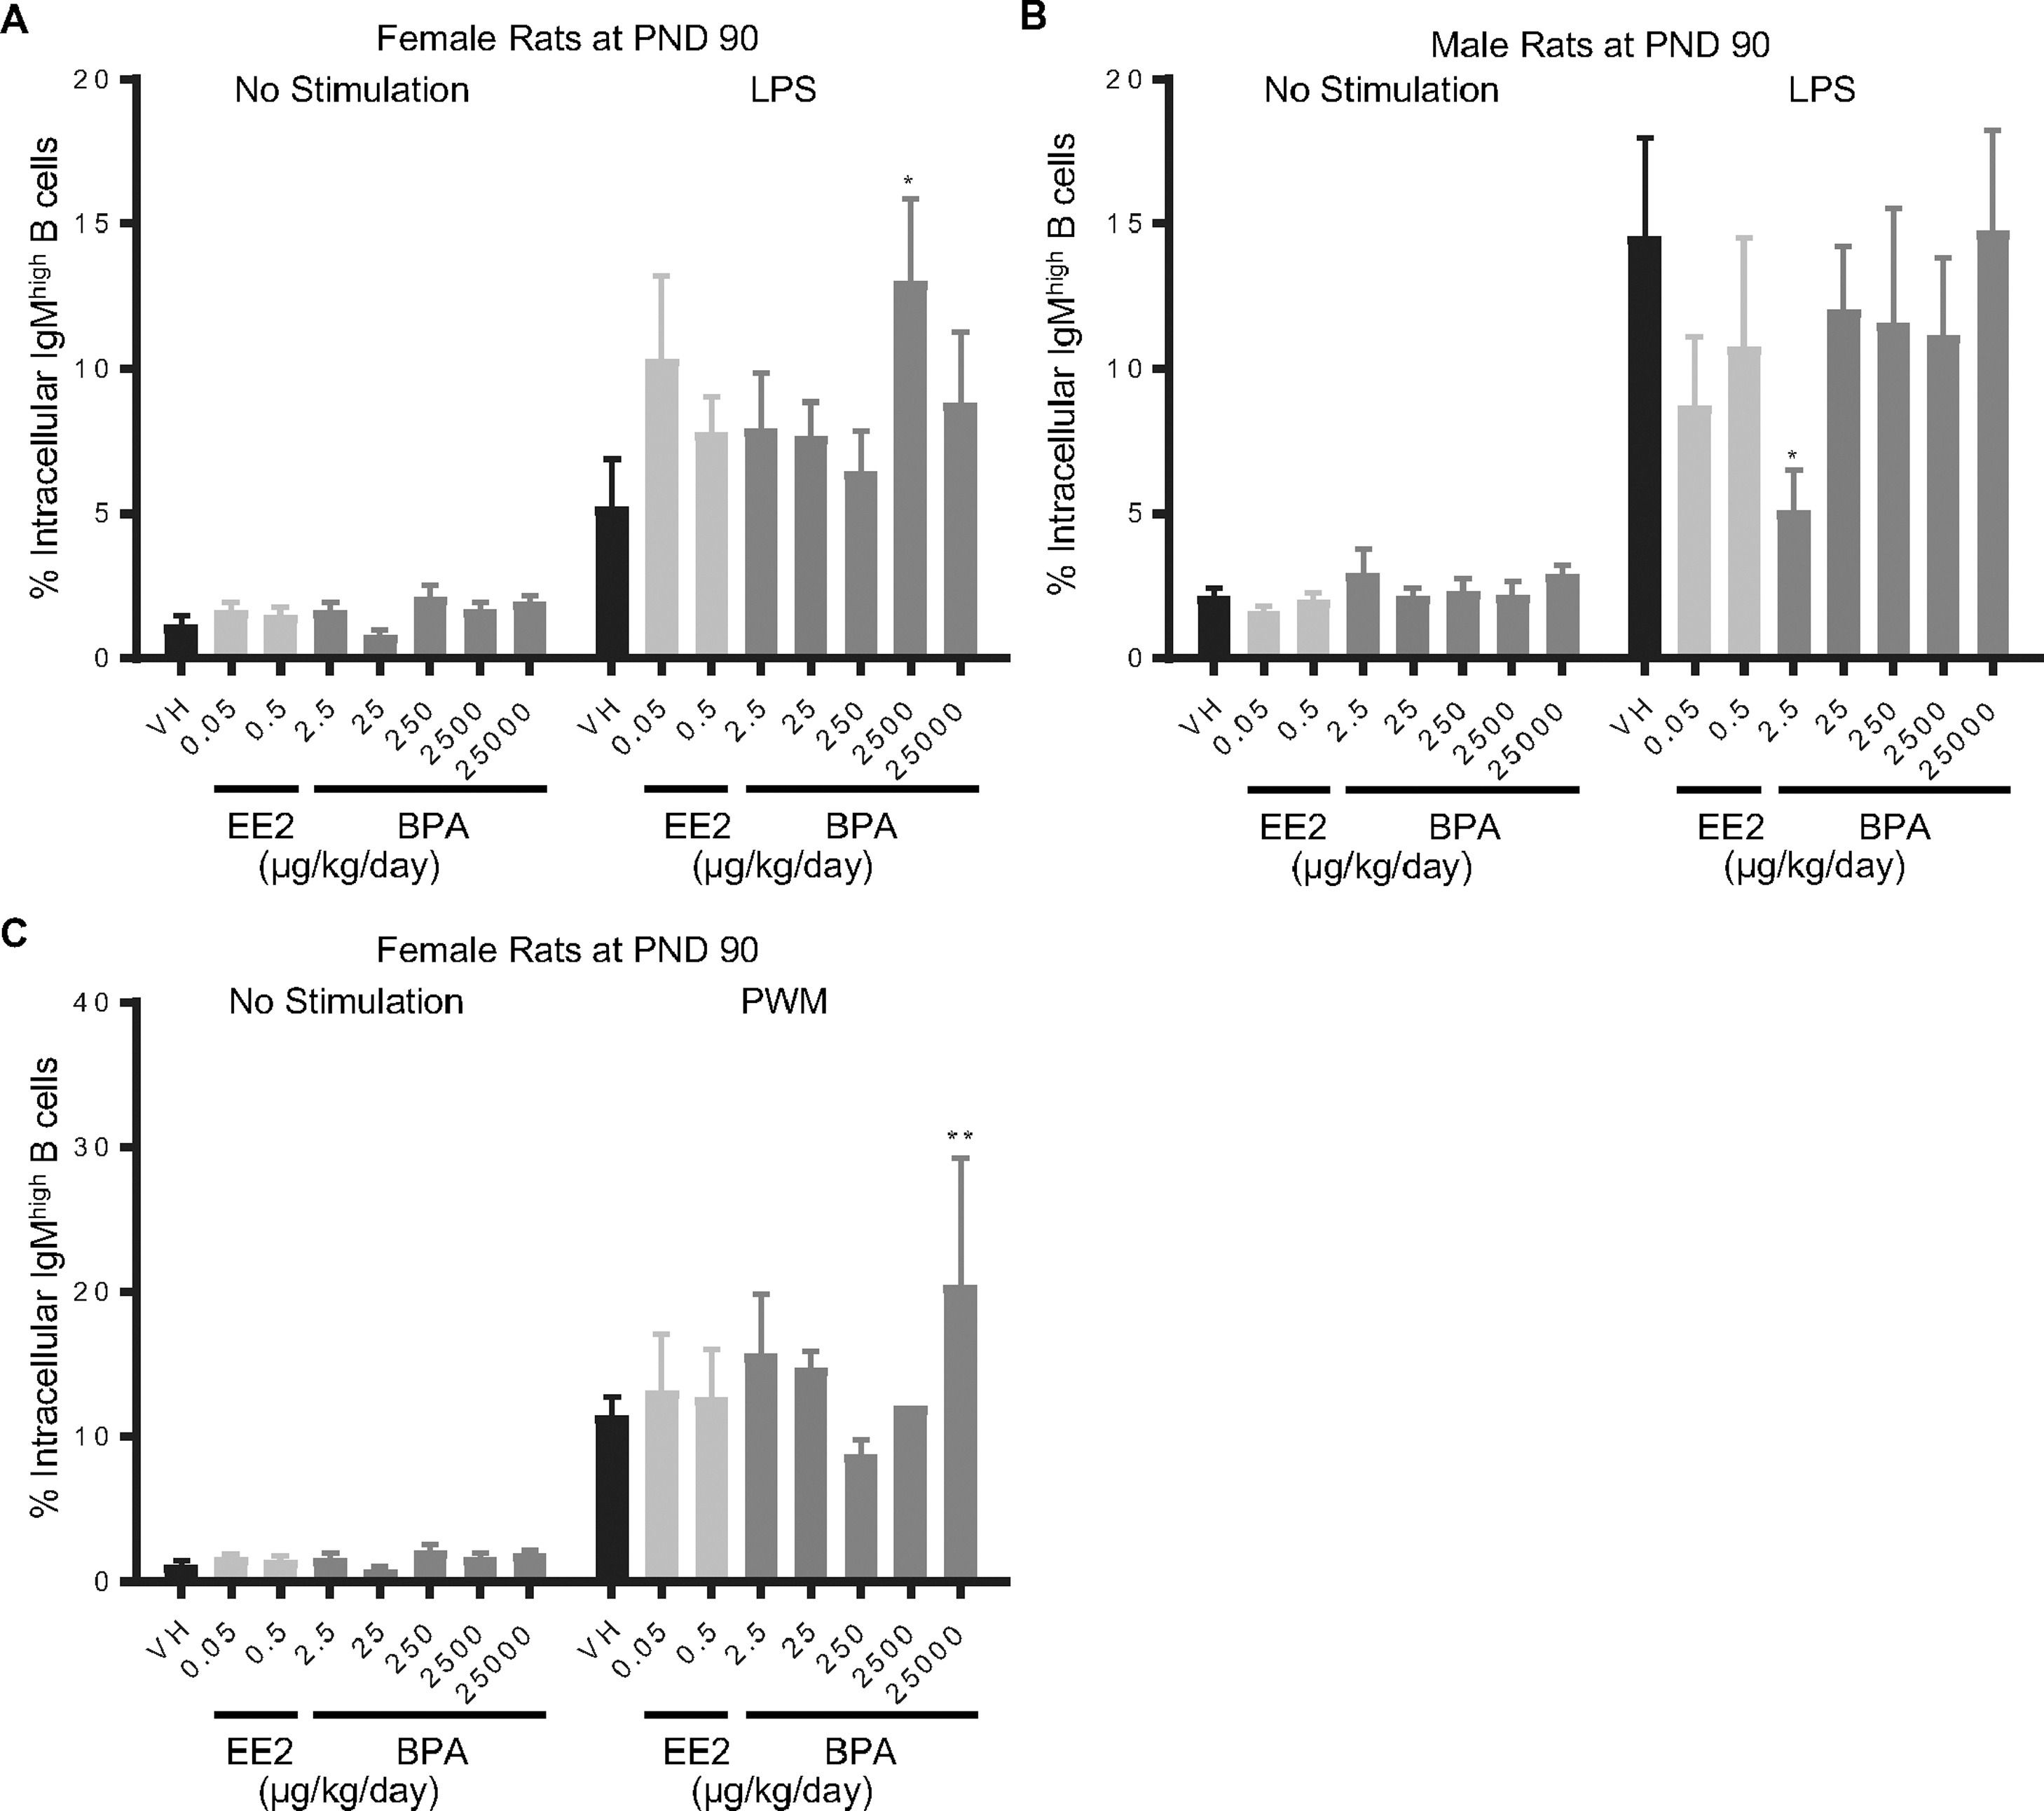
Figure 4. Percentage of intracellular IgMhigh splenic B cells by treatment group and sex.
Female (A, C) and male (B) rats were aadministered vehicle (VH, 0.3% aqueous carboxymethylcellulose), BPA or estrogen ethinyl estradiol (EE2) at the indicated dose level by oral gavage daily and sacrificed at postnatal day (PND) 90 day. Splenocytes were isolated and treated with LPS (A, B) or PWM (C) for 72 h. The percentage of IgMhigh B cells was quantified by flow cytometry.
Results are presented as mean ± SE. n = 1–10 rats/treatment group/sex, n = 1 rat in PWM treated 2500 μg BPA/kg/day female group. * p < 0.05, ** p < 0.01 when compared to respective vehicle control by a two way ANOVA with Dunnett’s posttest.
- Figure 4 (453 KB)
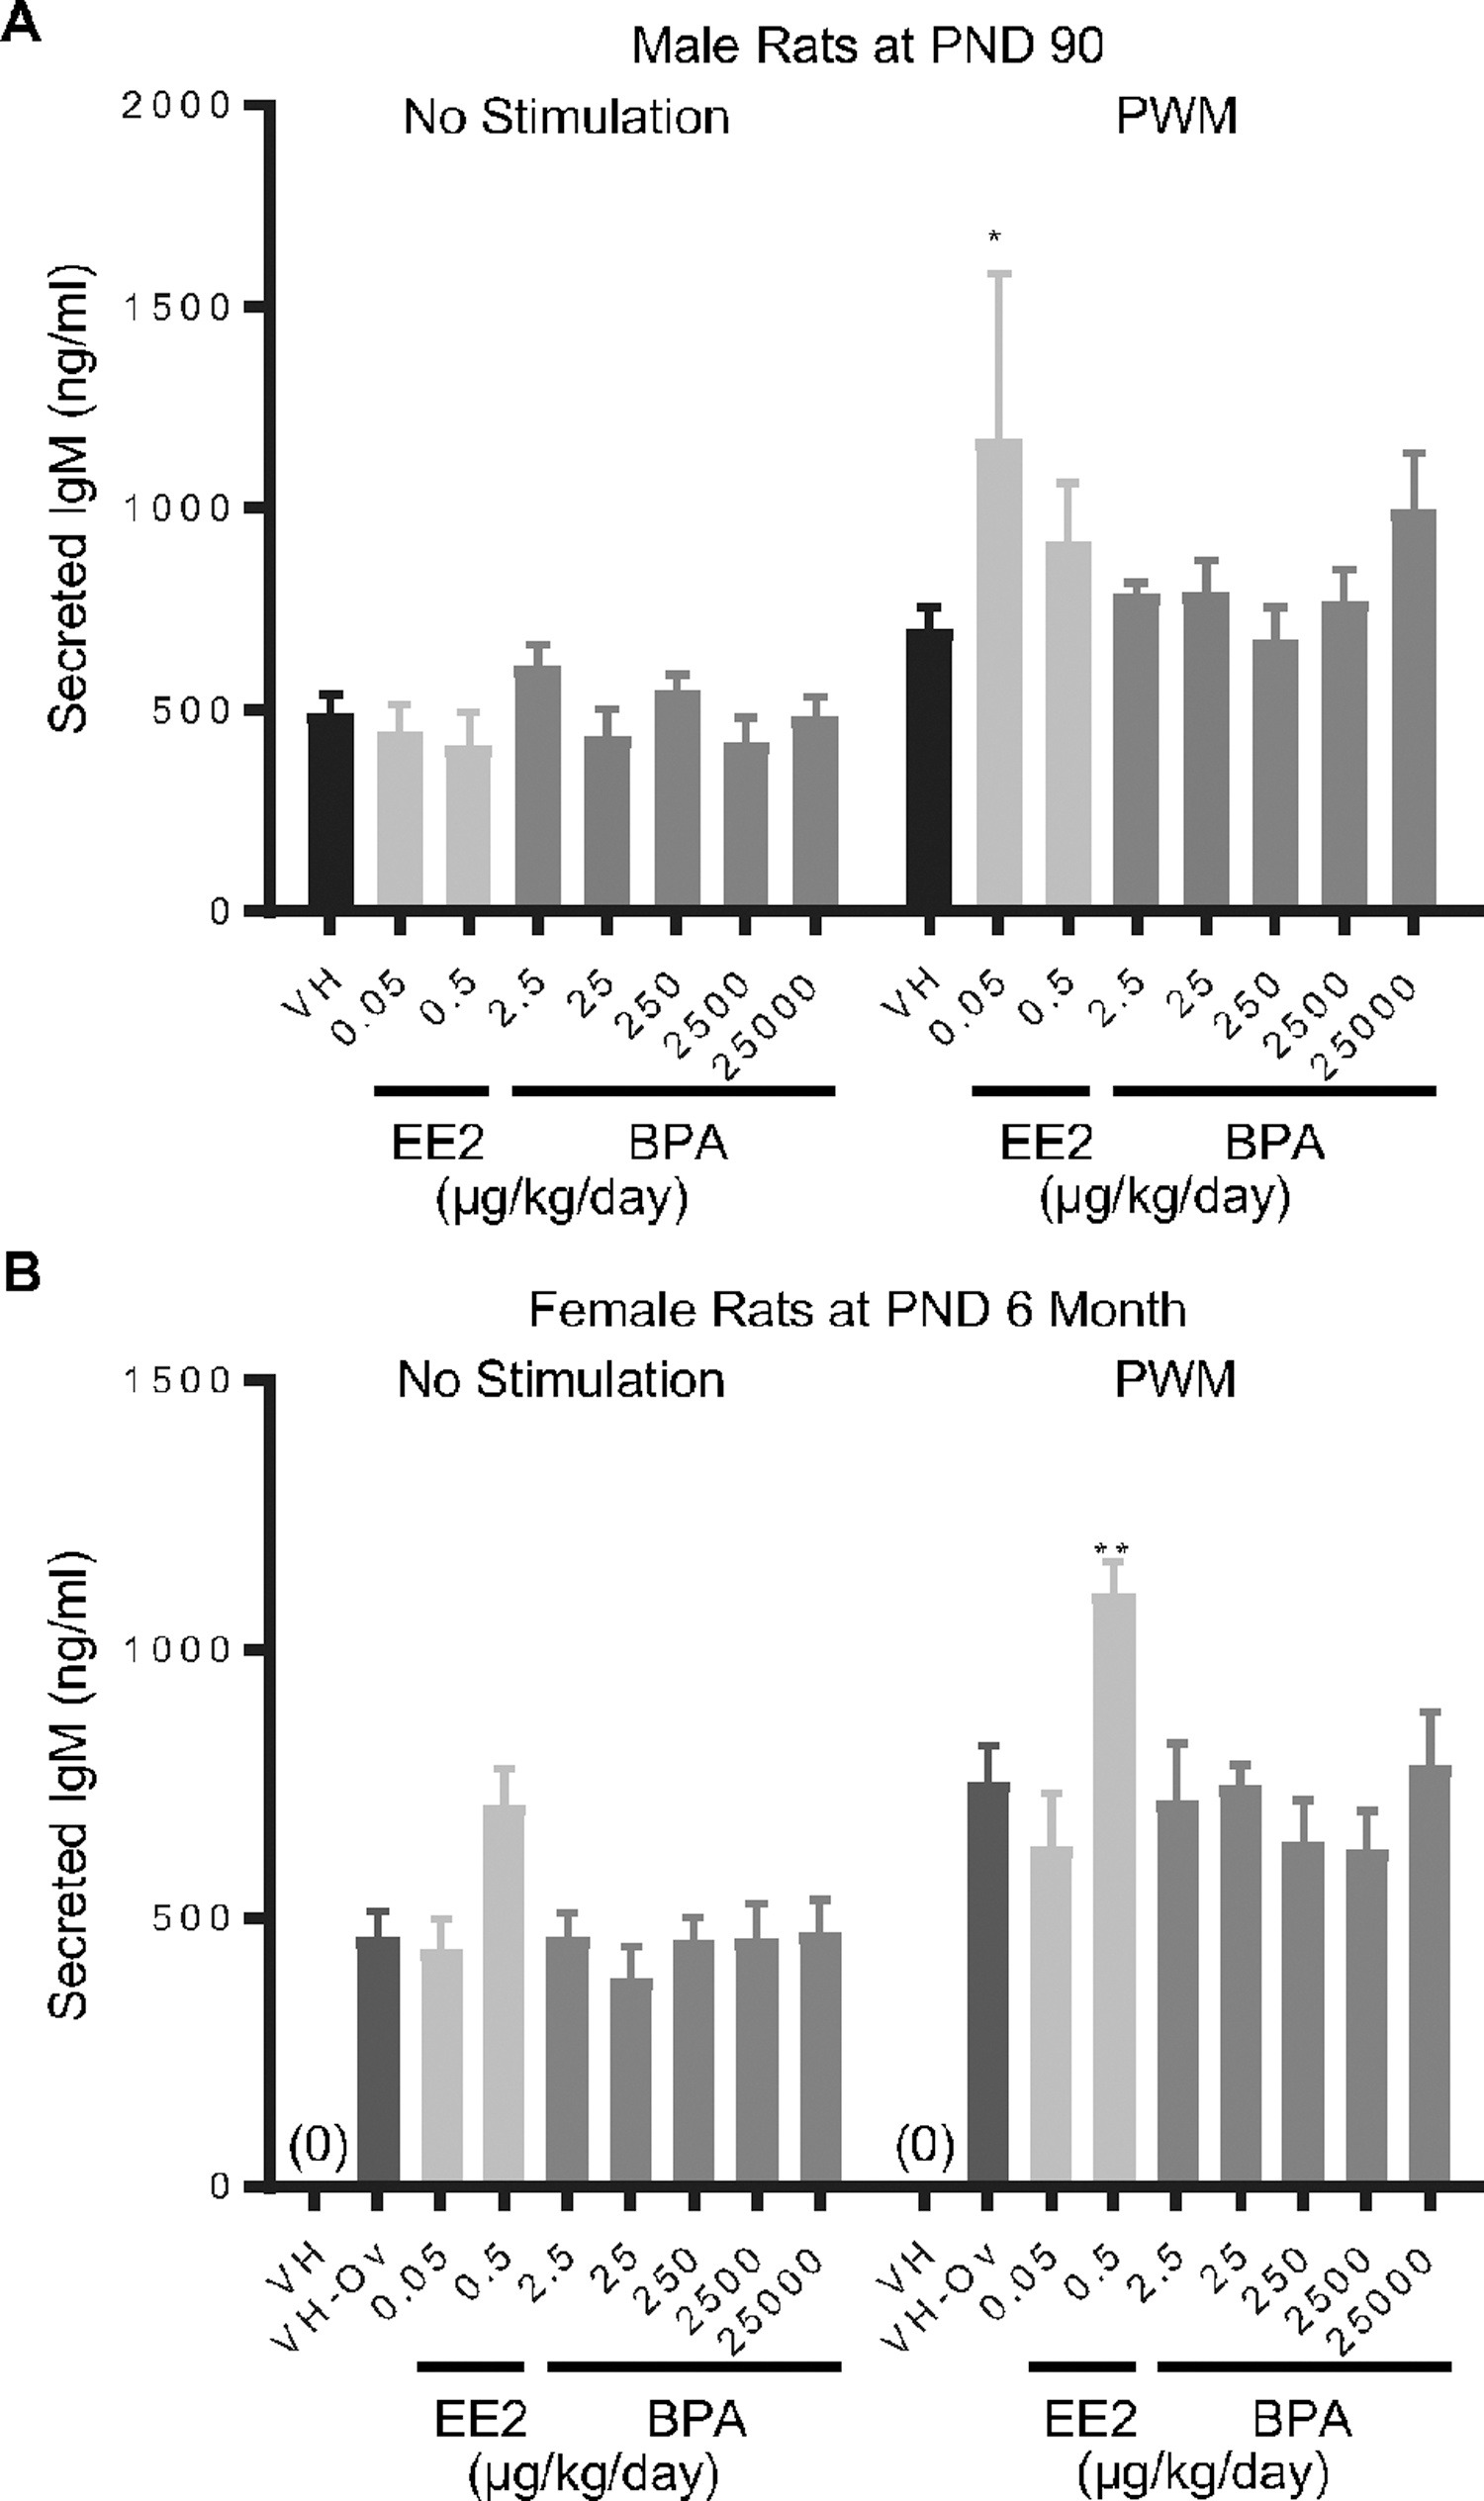
Figure 5. Quantification of pokeweed mitogen (PWM)-induced IgM secretion by splenic B cells by treatment group and sex.
Male (A) and female (B) rats were administered vehicle (VH, 0.3% aqueous carboxymethylcellulose), BPA or estrogen ethinyl estradiol (EE2) at the indicated dose level by oral gavage daily and sacrificed at postnatal day (PND) 90 day (A) and 6 month (B). Splenocytes were isolated and treated with PWM for 72 h. Post activation, supernatants were collected and the levels of secreted IgM were quantified by ELISA.
Results are presented as mean ± SE. n = 2–10 rats/treatment group/sex, n = 2 rats in PWM treated 0.05 μg EE/kg/day male group. * p < 0.05, ** p < 0.01 when compared to respective vehicle control (VH-Ov for female rats at PND 6 month) by a two way ANOVA with Dunnett’s posttest. For more details about VH-Ov, please see the Statistical Analysis section in the Materials and Methods.
- Figure 5 (306 KB)
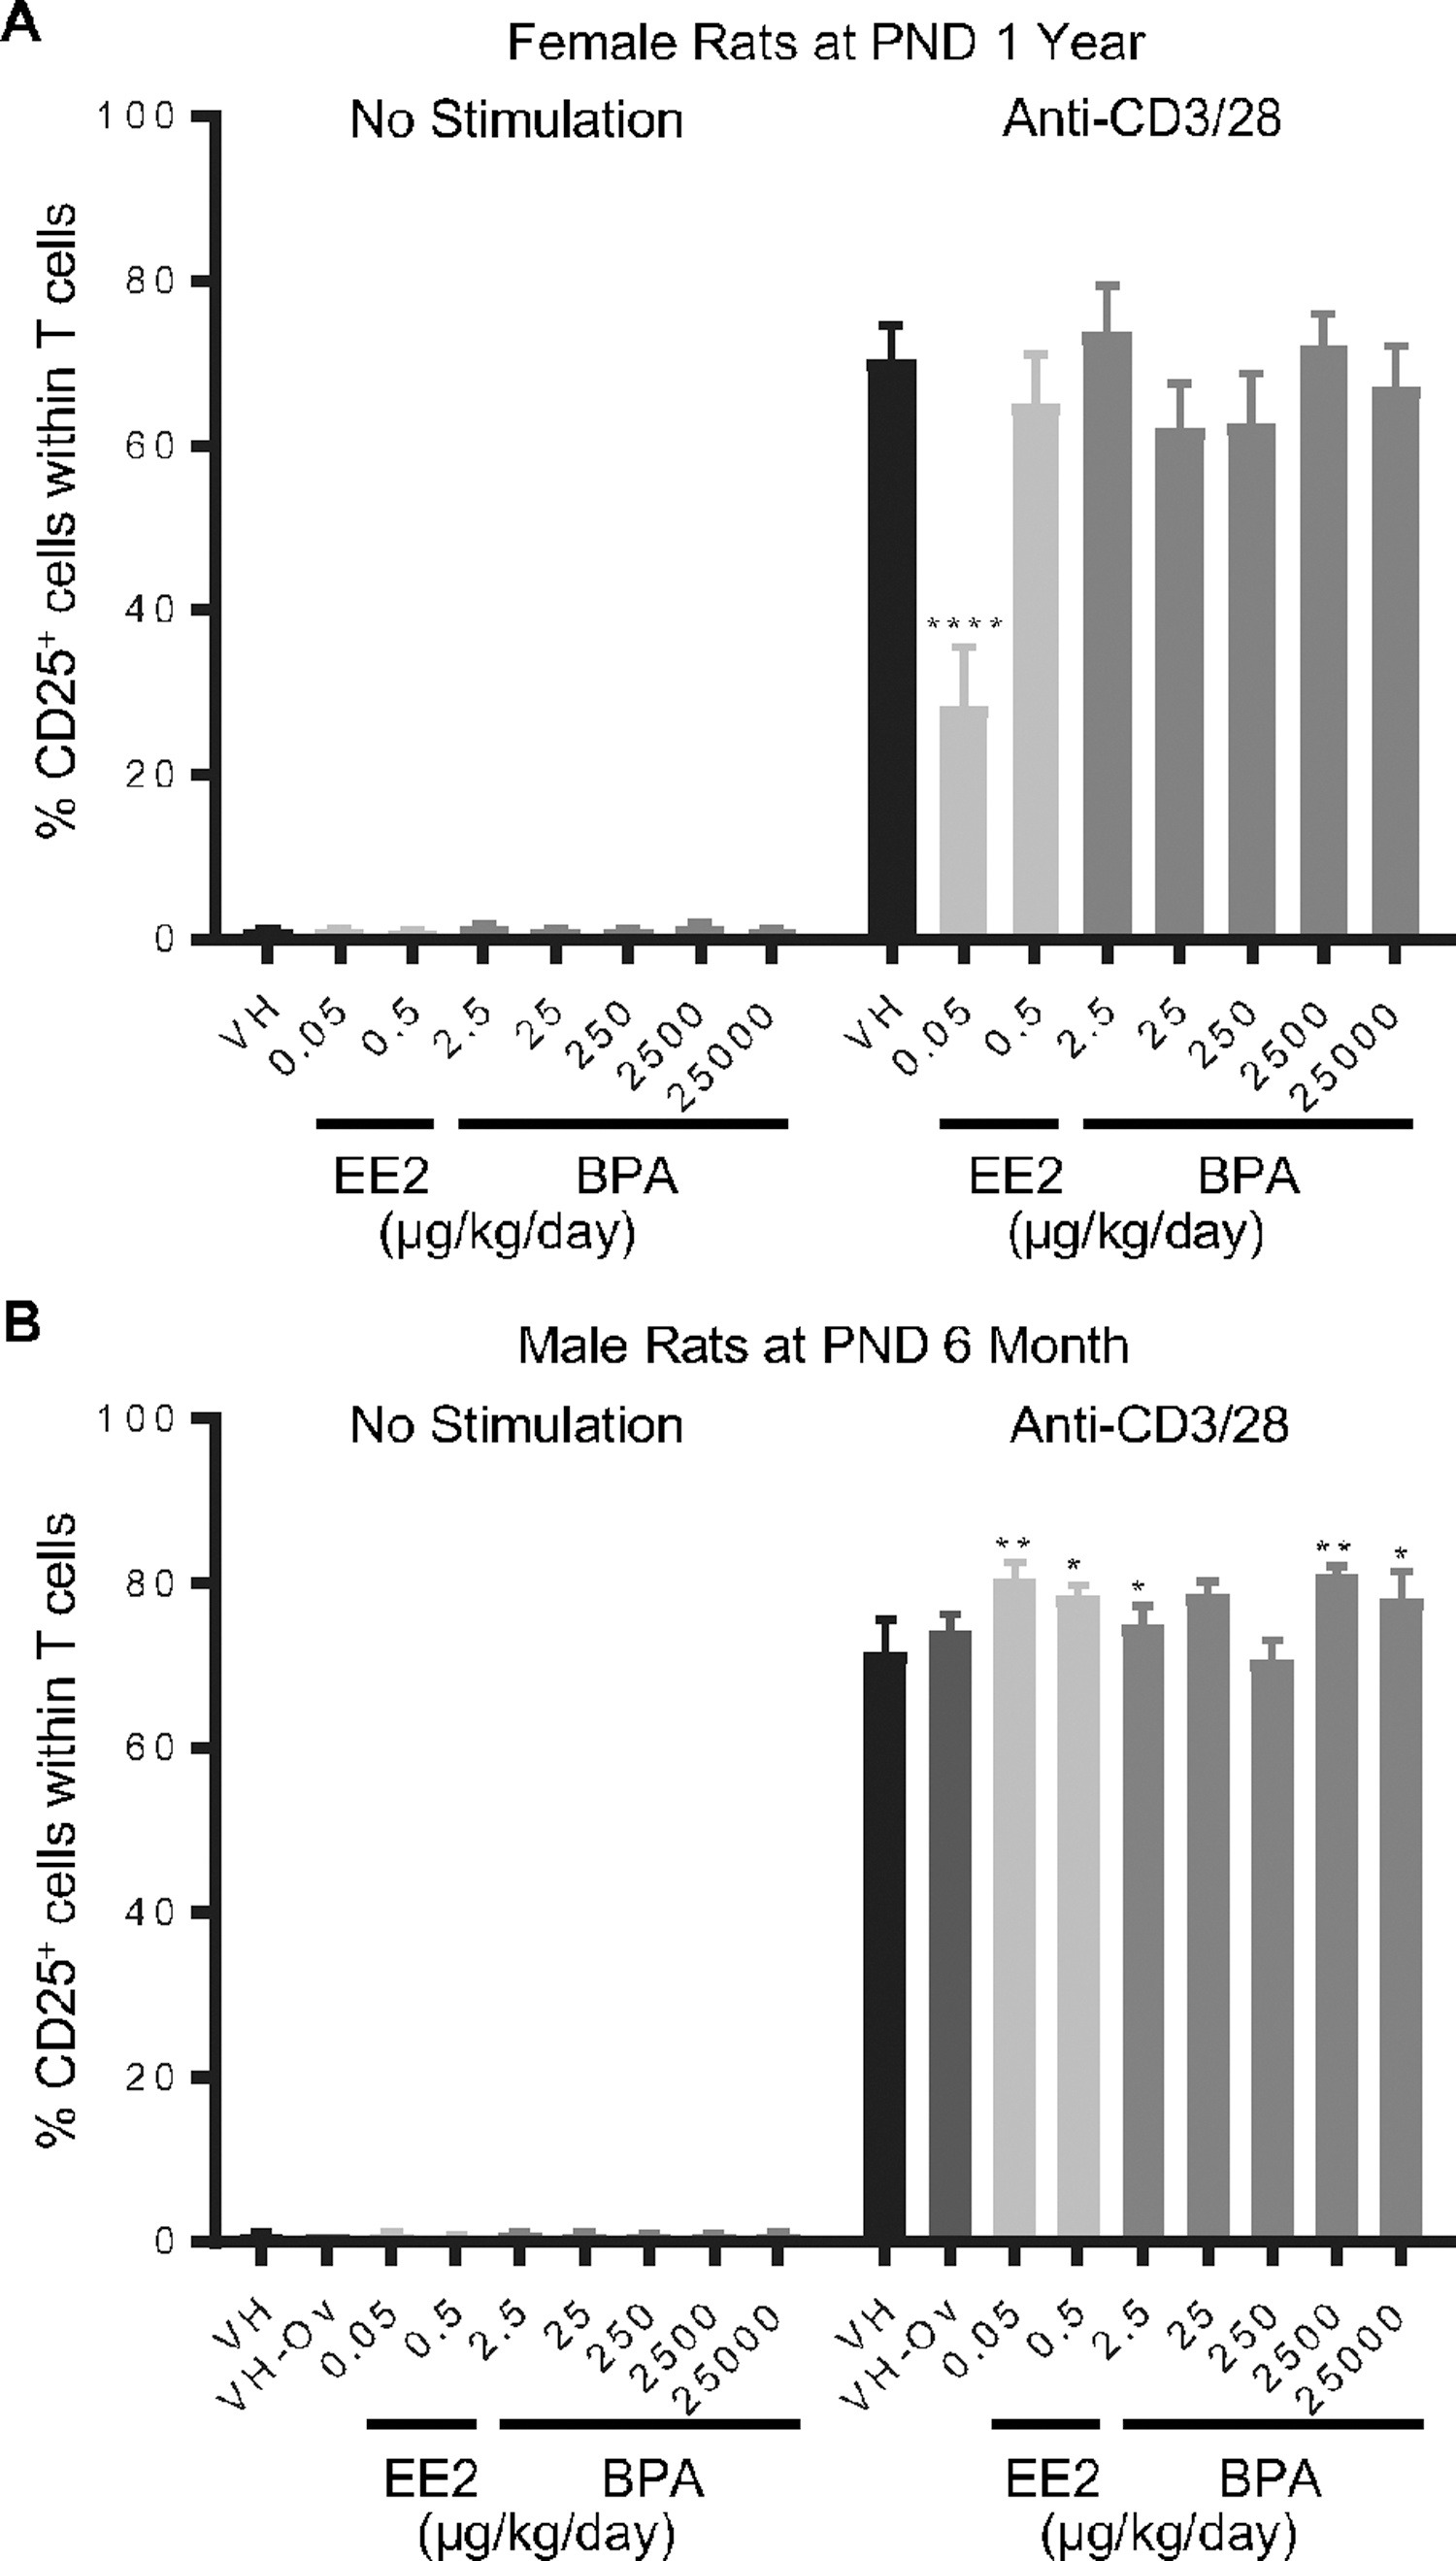
Figure 6. Percentage of CD25+ T cells post anti-CD3/28 activation by treatment group and sex.
Female (A) and male (B) rats were administered vehicle (VH, 0.3% aqueous carboxymethylcellulose), BPA or estrogen ethinyl estradiol (EE2) at the indicated dose level by oral gavage daily and sacrificed at postnatal day (PND) 1 year (A) and 6 month (B). Splenocytes were isolated and treated with anti-CD3/28 for 48 h. The percentage of CD25+ cells within splenic T cells was quantified by flow cytometry.
Results are presented as mean ± SE. n = 4–10 rats/treatment group/sex. * p < 0.05, ** p < 0.01, **** p < 0.0001 when compared to respective vehicle control by a two way ANOVA with Dunnett’s posttest.
- Figure 6 (333 KB)
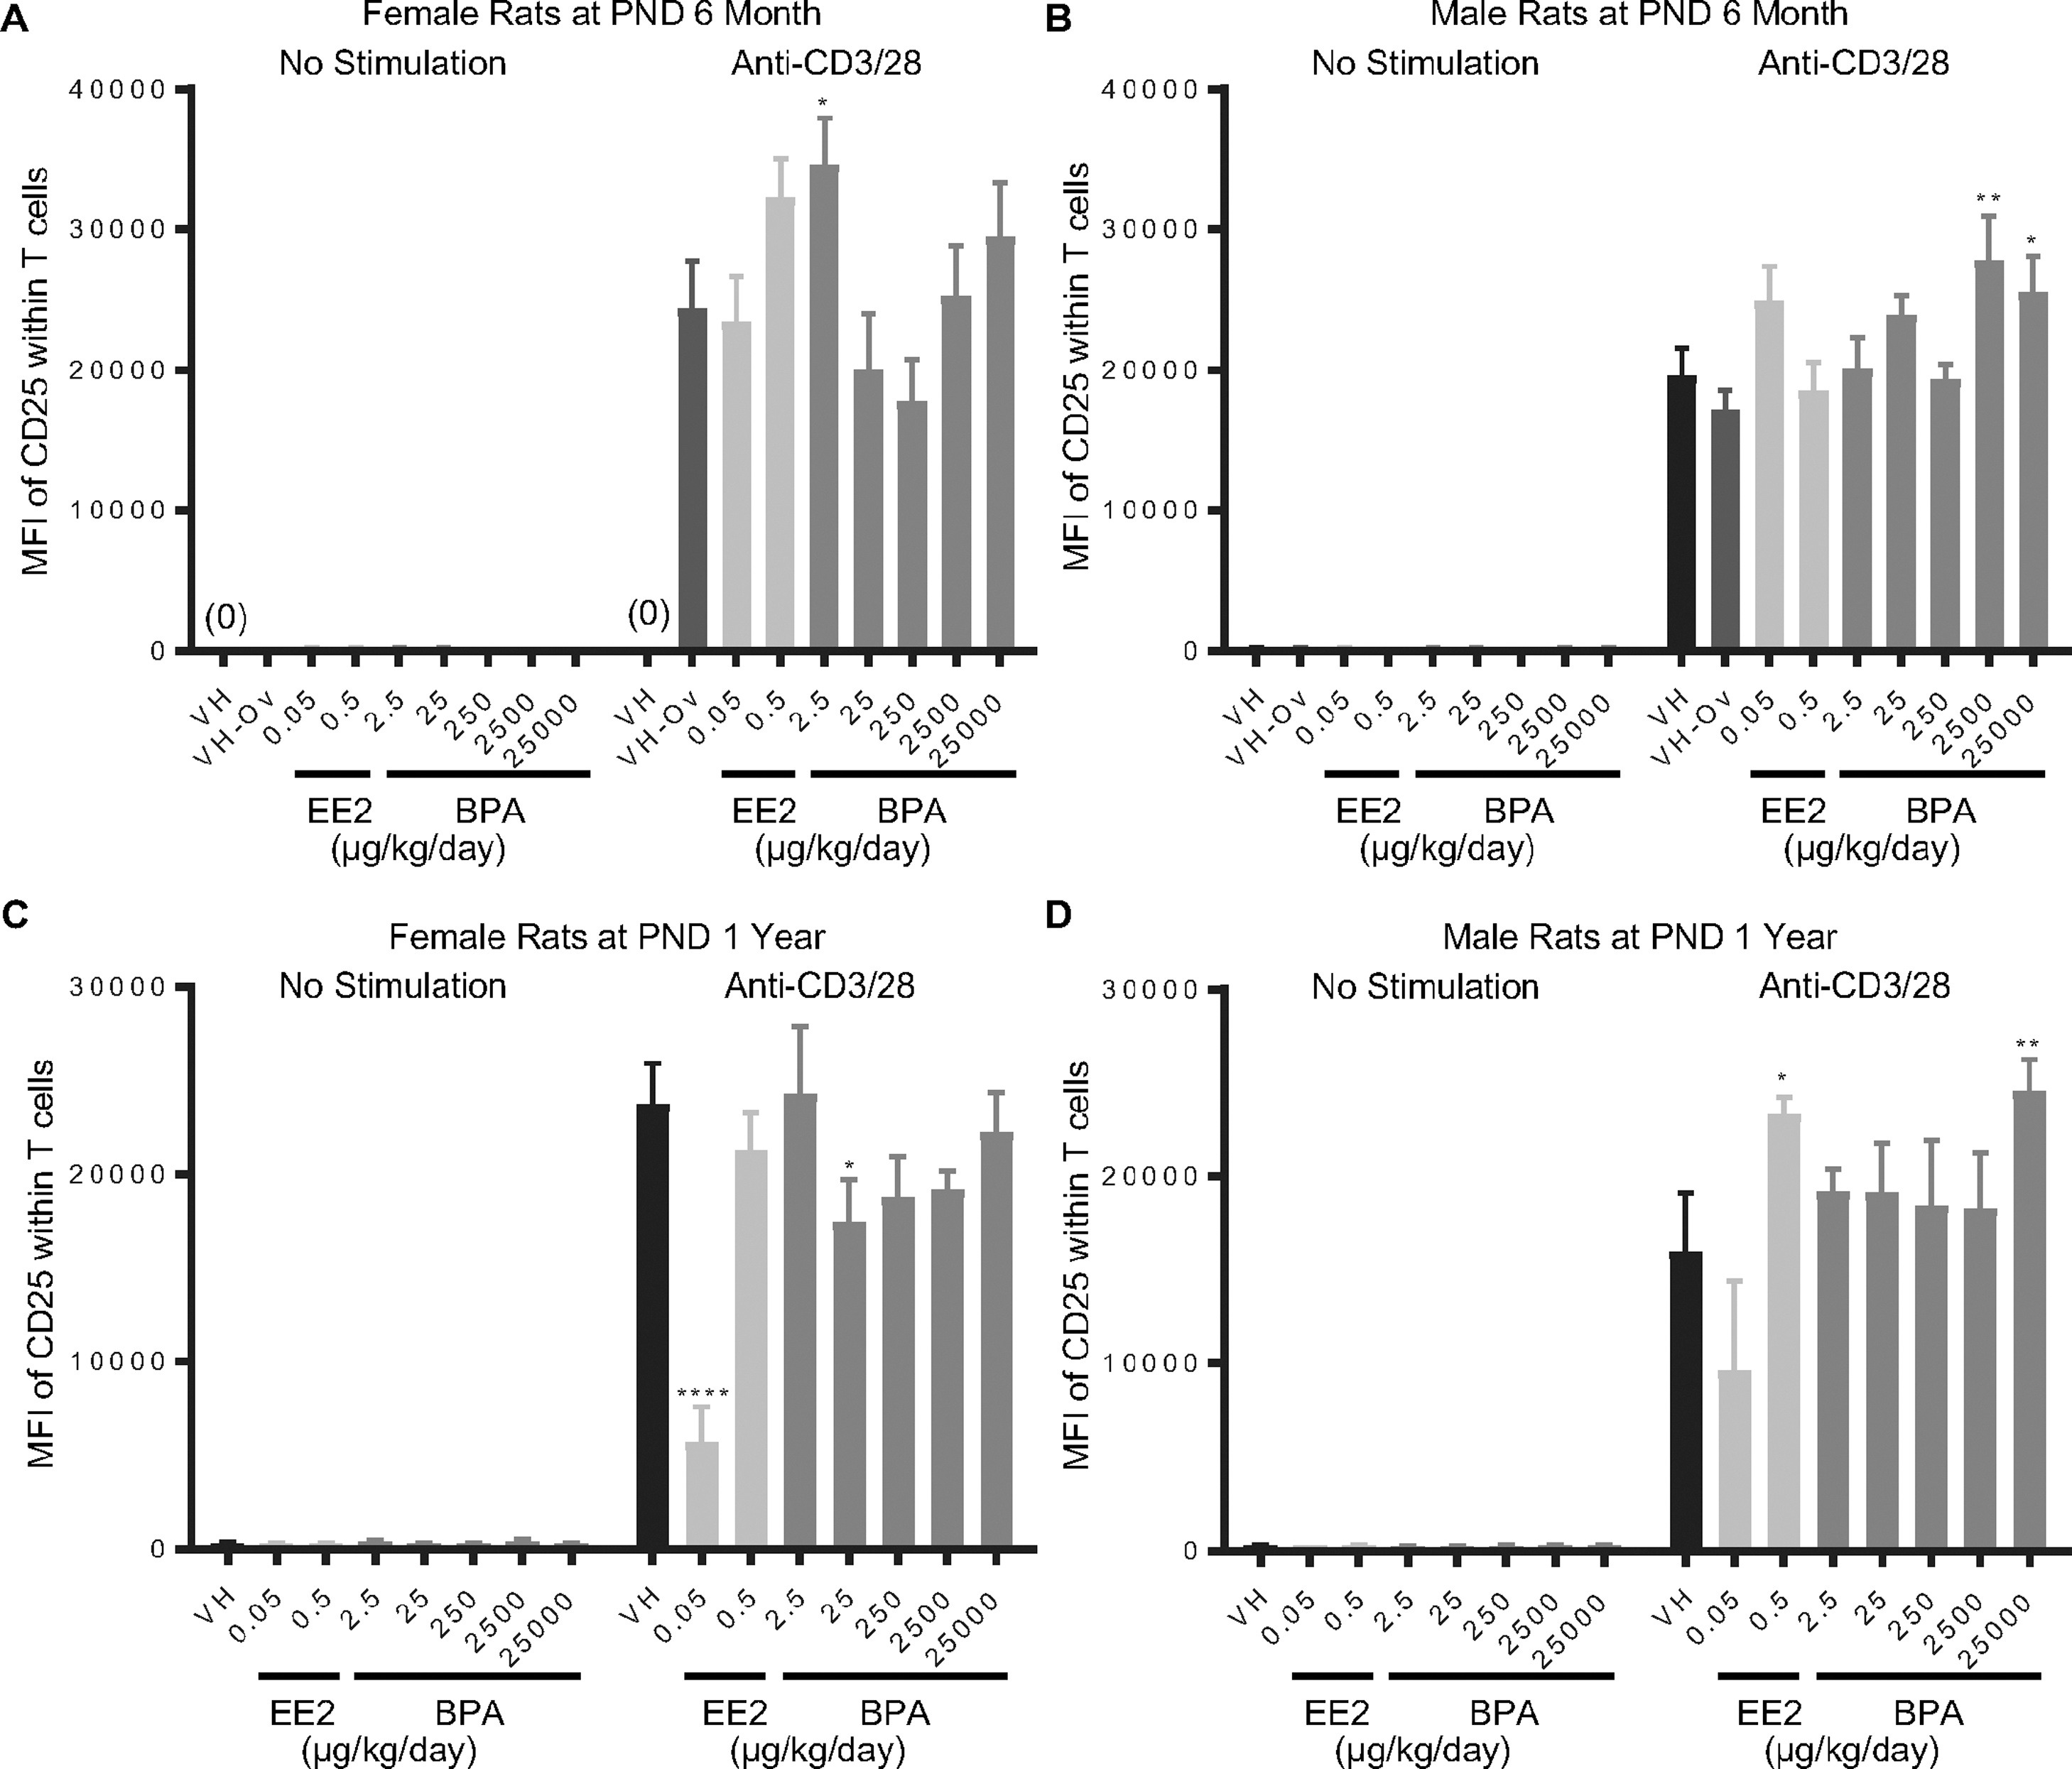
Figure 7. Quantification of the CD25 expression level on T cells post anti-CD3/28 activation by treatment group and sex.
Female (A, C) and male (B, D) rats were administered vehicle (VH, 0.3% aqueous carboxymethylcellulose), BPA or estrogen ethinyl estradiol (EE2) at the indicated dose level by oral gavage daily and sacrificed at postnatal day (PND) 6 month (A, B) and 1 year (C, D). Splenocytes were isolated and treated with anti-CD3/28 for 48 h. The expression levels of CD25 on splenic T cells, represented as mean fluorescence intensity (MFI), were quantified by flow cytometry.
Results are presented as mean ± SE. n = 2–10 rats/treatment group/sex, n = 2 rats in PND 1 year 250 μg BPA/kg/day male groups. * p < 0.05, ** p < 0.01, **** p < 0.0001 when compared to respective vehicle control (VH-Ov for female rats at PND 6 month) by a two way ANOVA with Dunnett’s posttest. For more details about VH-Ov, please see the Statistical Analysis section in the Materials and Methods.
- Figure 7 (597 KB)
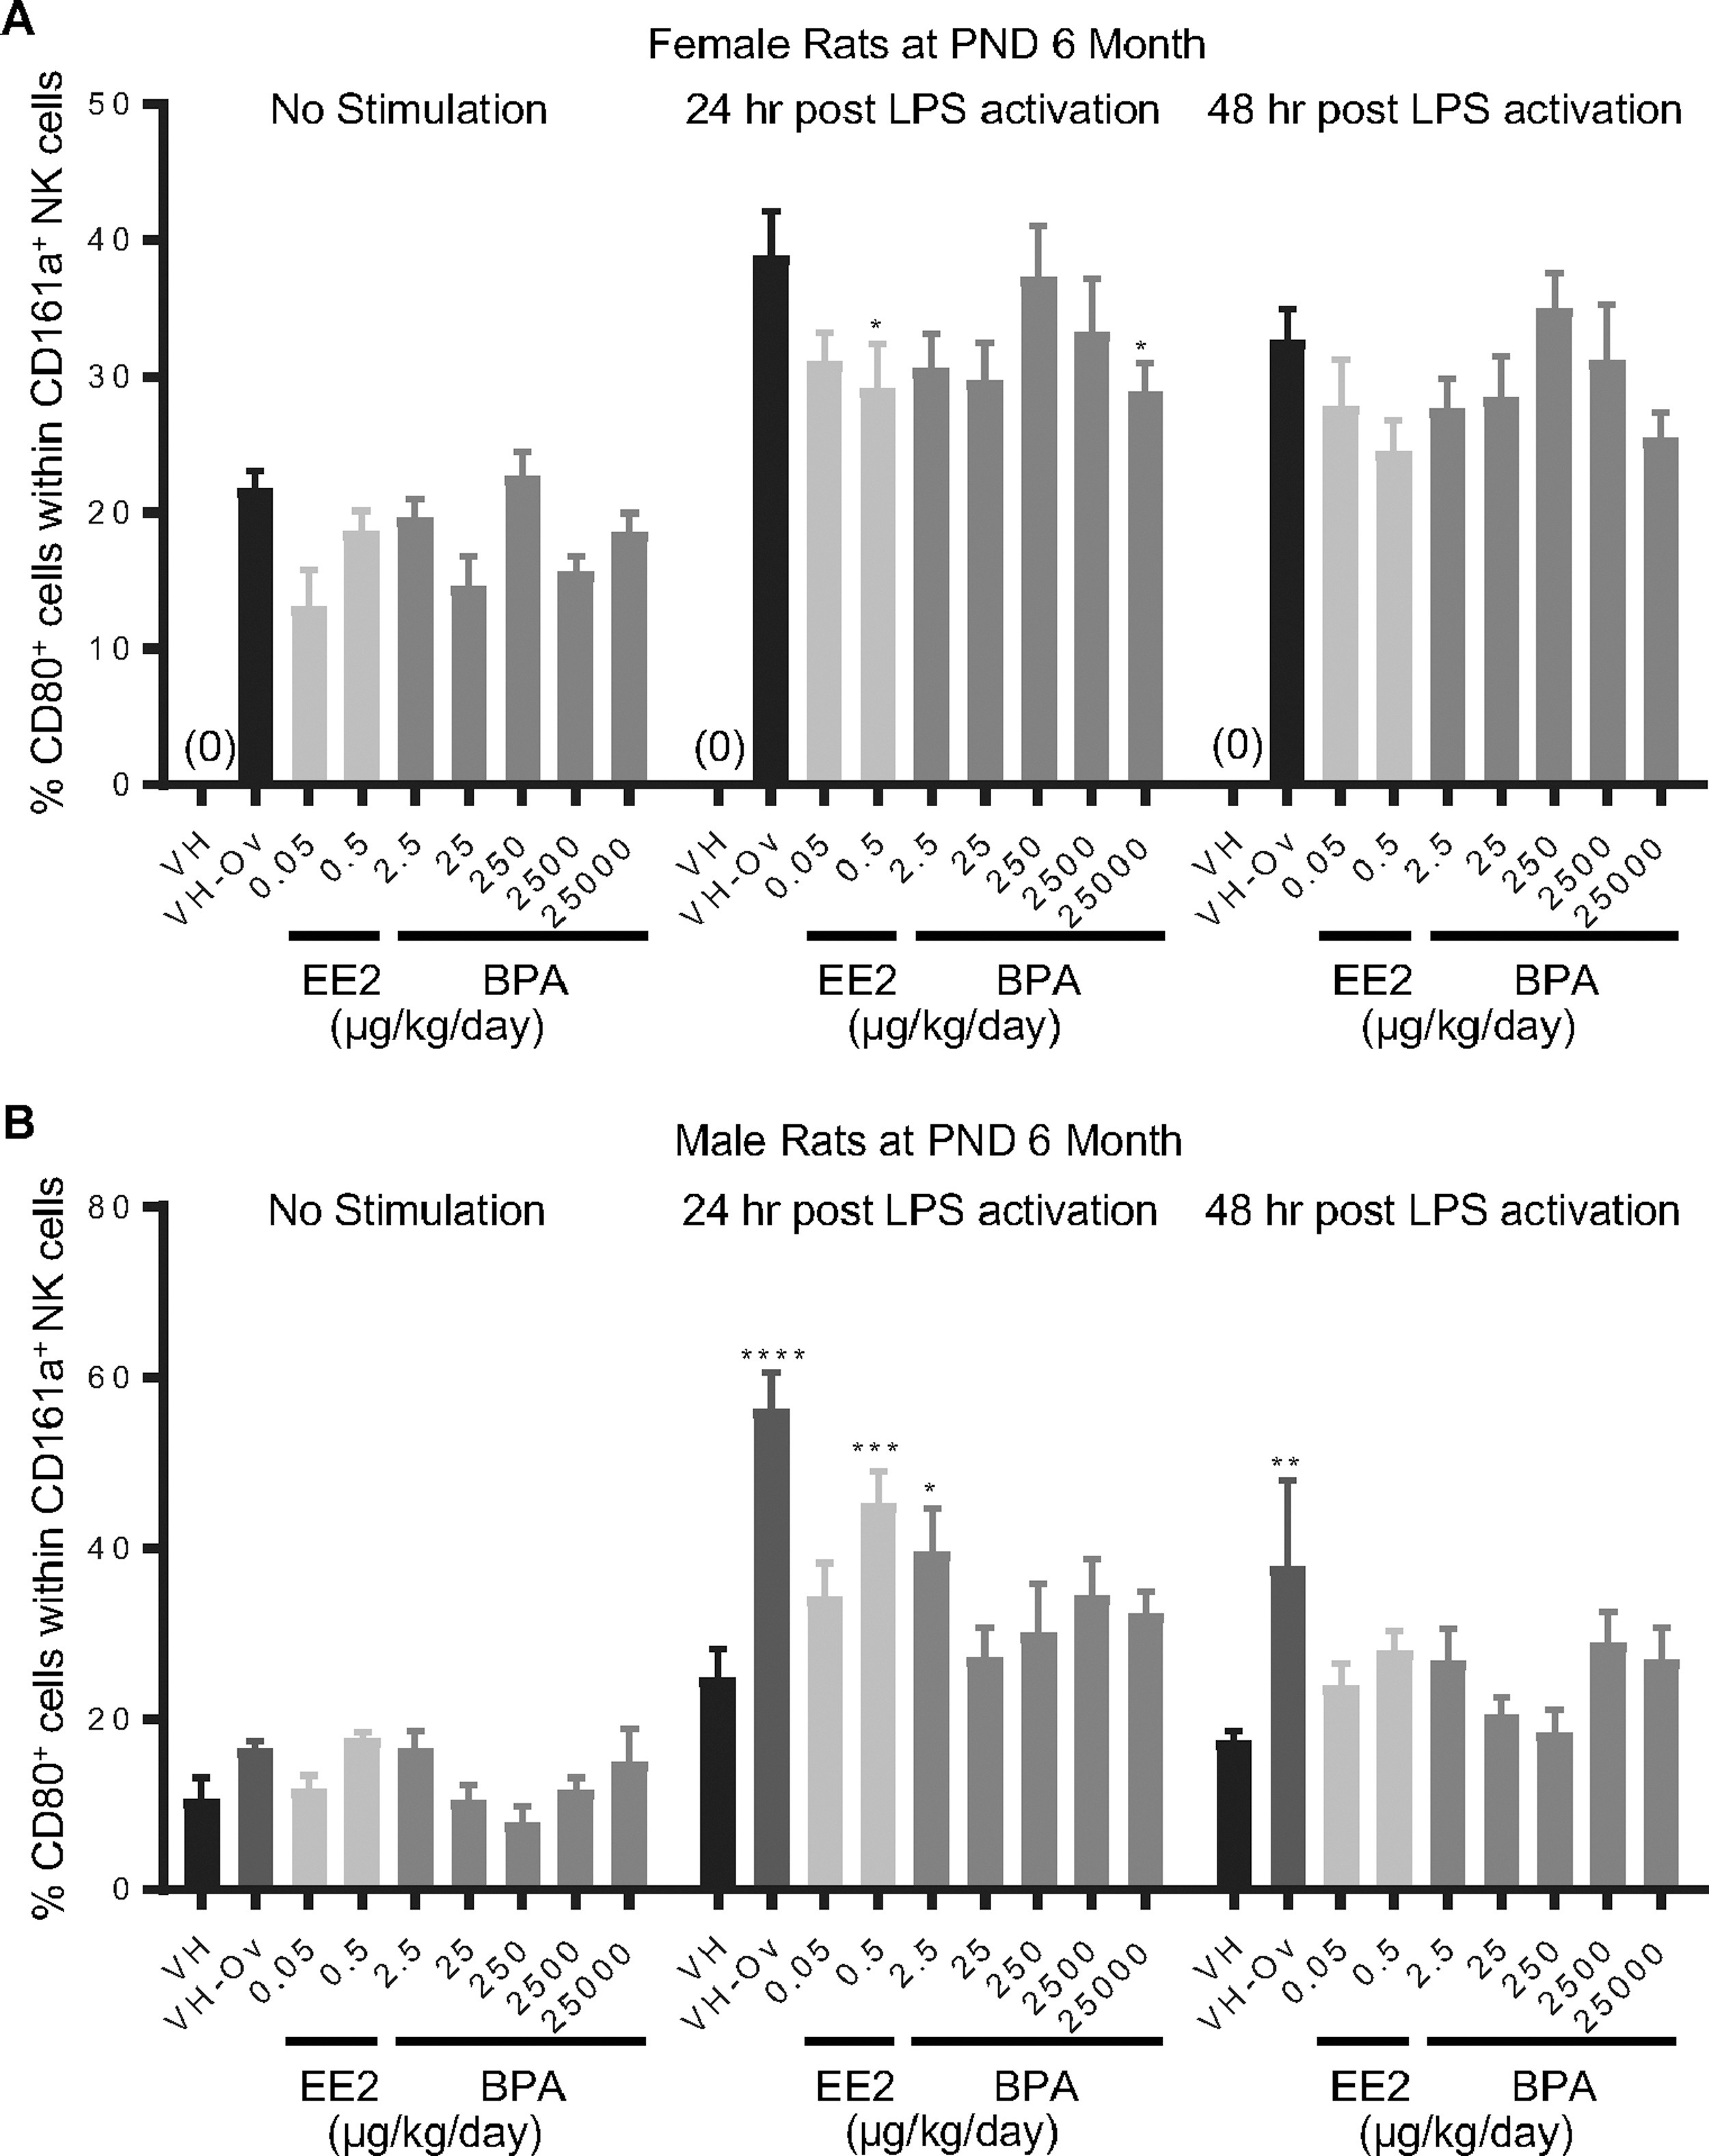
Figure 8. Percentage of CD80+ cells within the NK cell population post LPS activation from by treatment group and sex.
Female (A) and male (B) rats were administered vehicle (VH, 0.3% aqueous carboxymethylcellulose), BPA or estrogen ethinyl estradiol (EE2) at the indicated dose level by oral gavage daily and sacrificed at postnatal day (PND) 6 months. Splenocytes were isolated and treated with LPS for up to 48 h. The percentage of CD80+ cells within CD161a+ NK cells was quantified by flow cytometry.
Results are presented as mean ± SE. n = 3–10 rats/treatment group/sex. * p < 0.05, ** p < 0.01, *** p < 0.001, **** p < 0.0001 when compared to respective vehicle control (VH-Ov for female rats at PND 6 month) by a two way ANOVA with Dunnett’s posttest. For more details about VH-Ov, please see the Statistical Analysis section in the Materials and Methods.
- Figure 8 (635 KB)
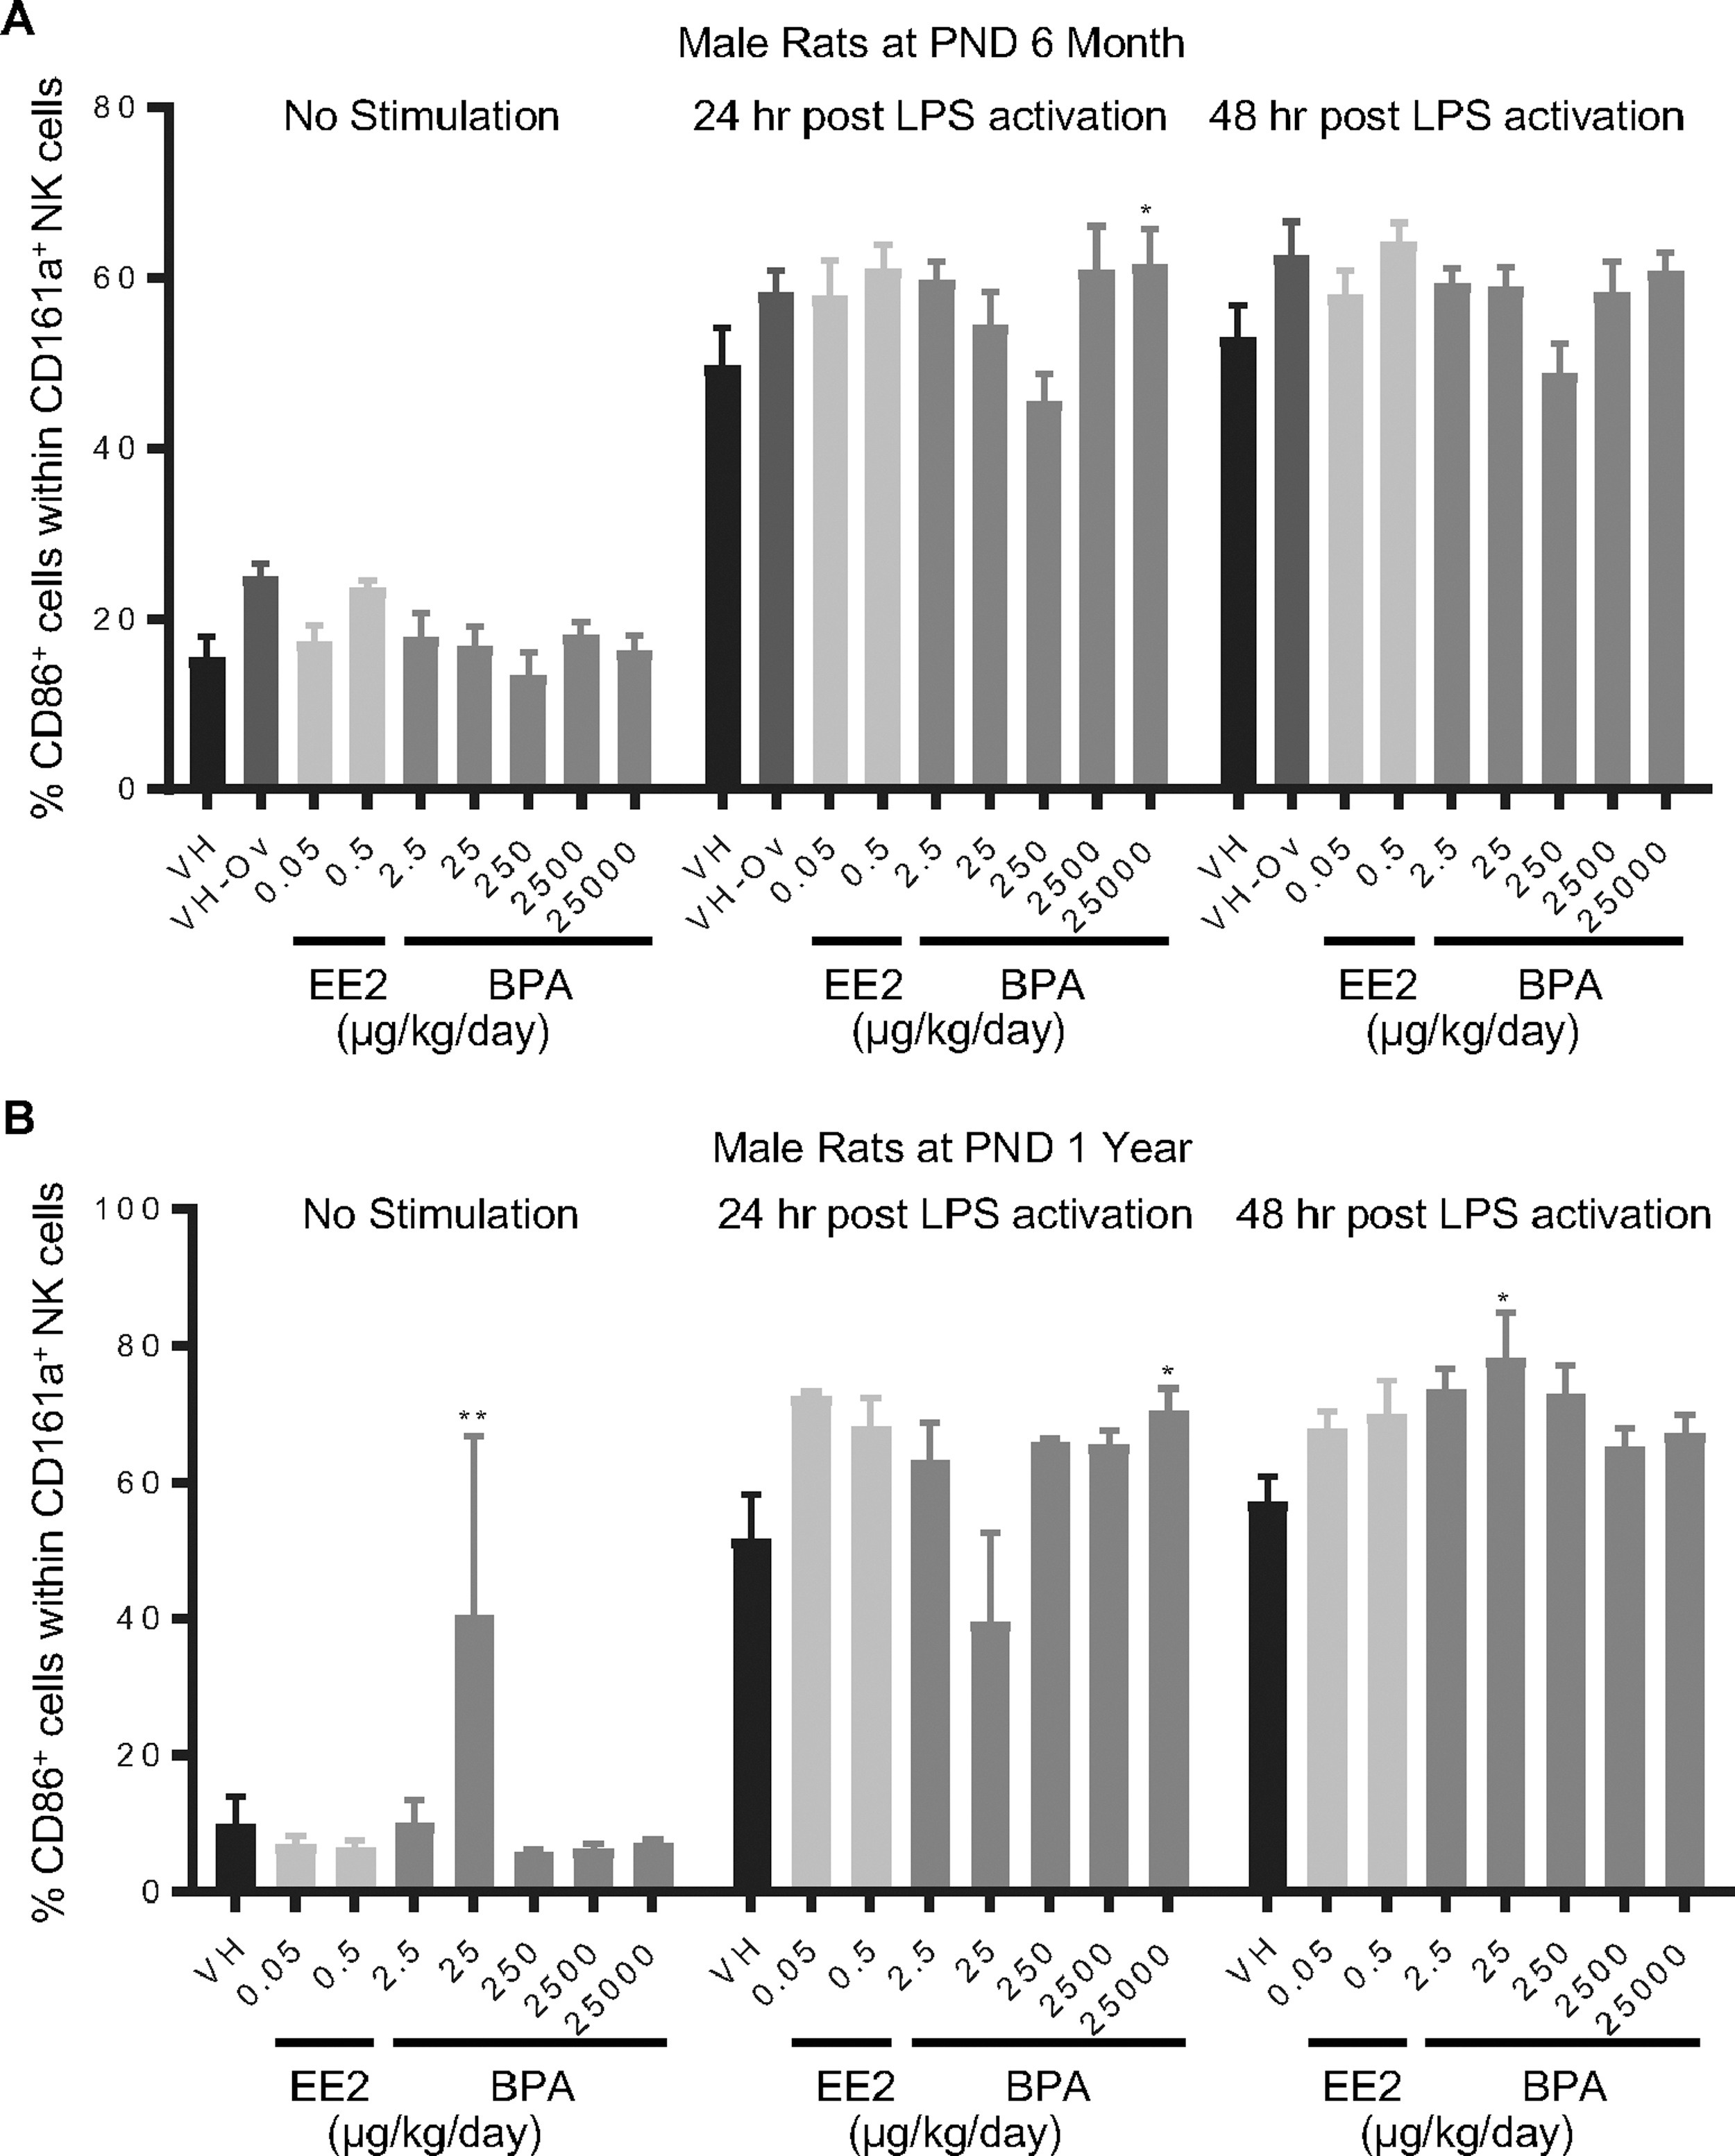
Figure 9. Percentage of CD86+ cells within the NK cell population post LPS activation by treatment group and sex.
Male rats were administered vehicle (VH, 0.3% aqueous carboxymethylcellulose), BPA or estrogen ethinyl estradiol (EE2) at the indicated dose level by oral gavage daily and sacrificed at postnatal day (PND) 6 months (A) and 1 year (B). Splenocytes were isolated and treated with LPS for up to 48 h. The percentage of CD86+ cells within CD161a+ NK cells was quantified by flow cytometry.
Results are presented as mean ± SE. n = 3–10 rats/treatment group/sex. * p < 0.05, ** p < 0.01 when compared to respective vehicle control by a two way ANOVA with Dunnett’s posttest.
- Figure 9 (648 KB)
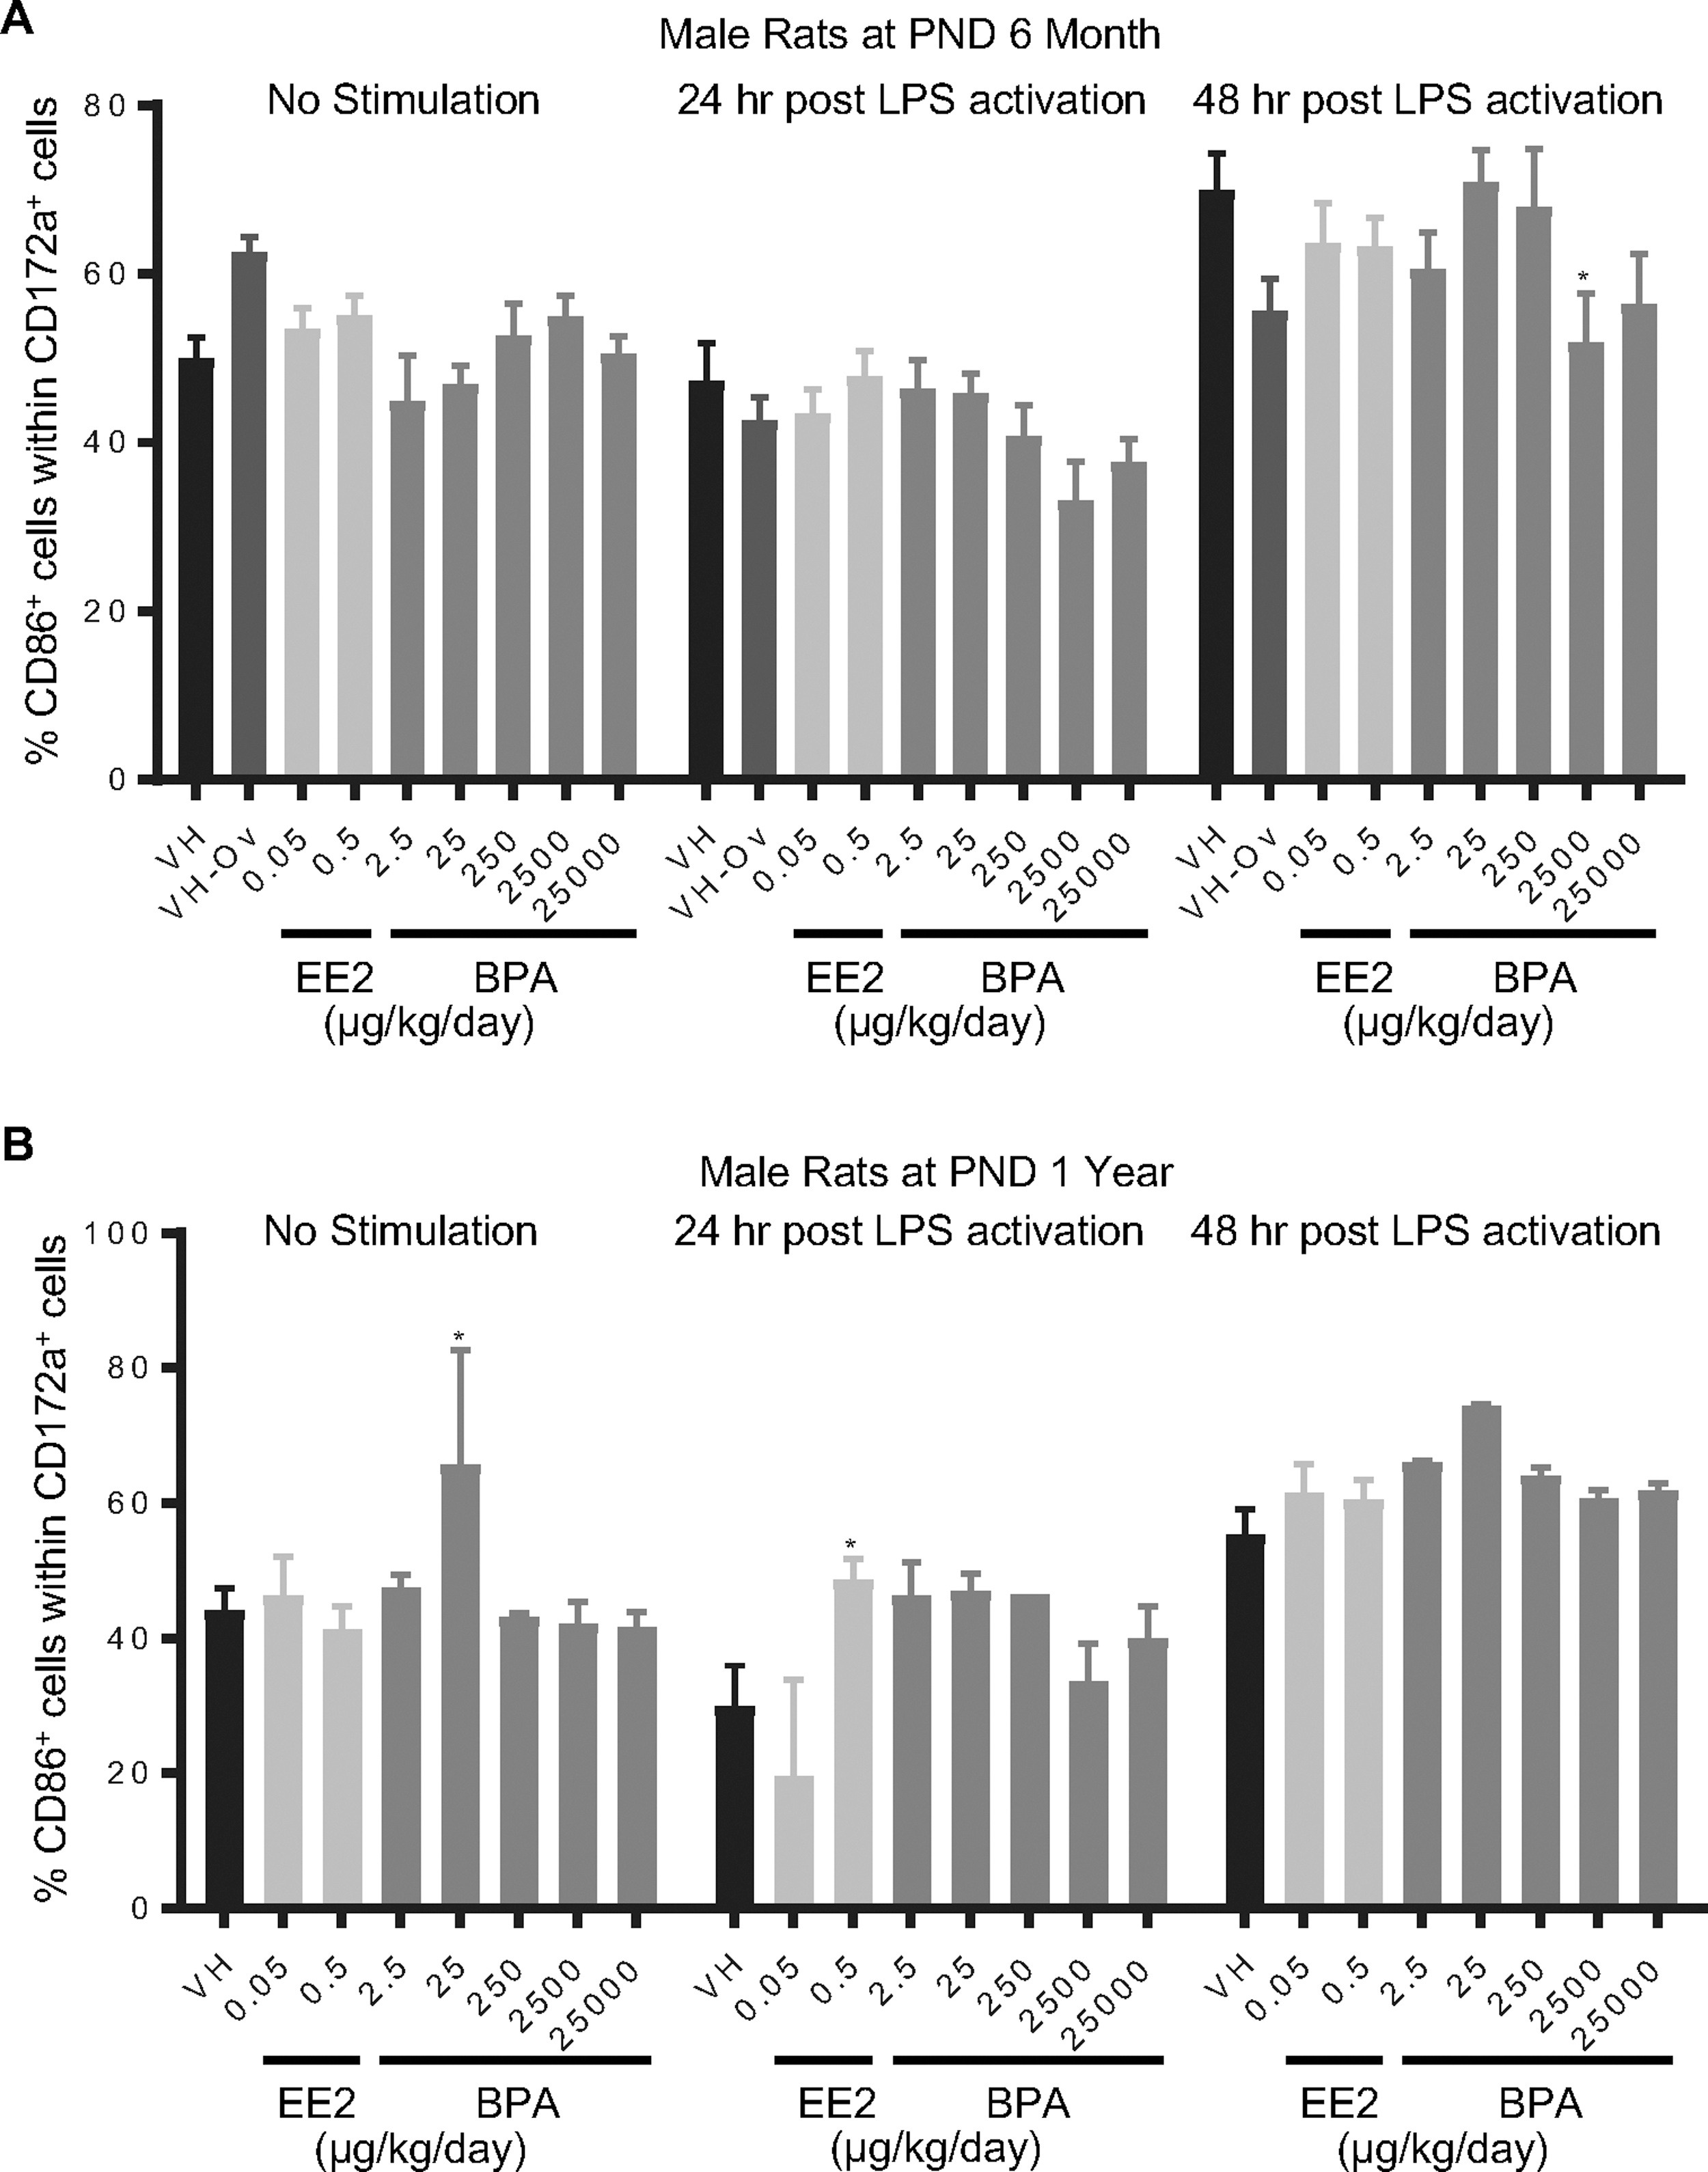
Figure 10. Percentage of CD86+ monocyte/macrophage/granulocytes post LPS activation by treatment group and sex.
Male rats were administered vehicle (VH, 0.3% aqueous carboxymethylcellulose), BPA or estrogen ethinyl estradiol (EE2) at the indicated dose level by oral gavage daily and sacrificed at postnatal day (PND) 6 months (A) and 1 year (B). Splenocytes were isolated and treated with LPS for up to 48 h. The percentage of CD86+ cells within CD172a+ monocyte/macrophage/granulocytes was quantified by flow cytometry.
Results are presented as mean ± SE. n = 2–10 rats/treatment group/sex, n = 2 rats in PND 1 year 250 μg BPA/kg/day male groups. * p < 0.05 when compared to respective vehicle control by a two way ANOVA with Dunnett’s posttest.
- Figure 10 (661 KB)
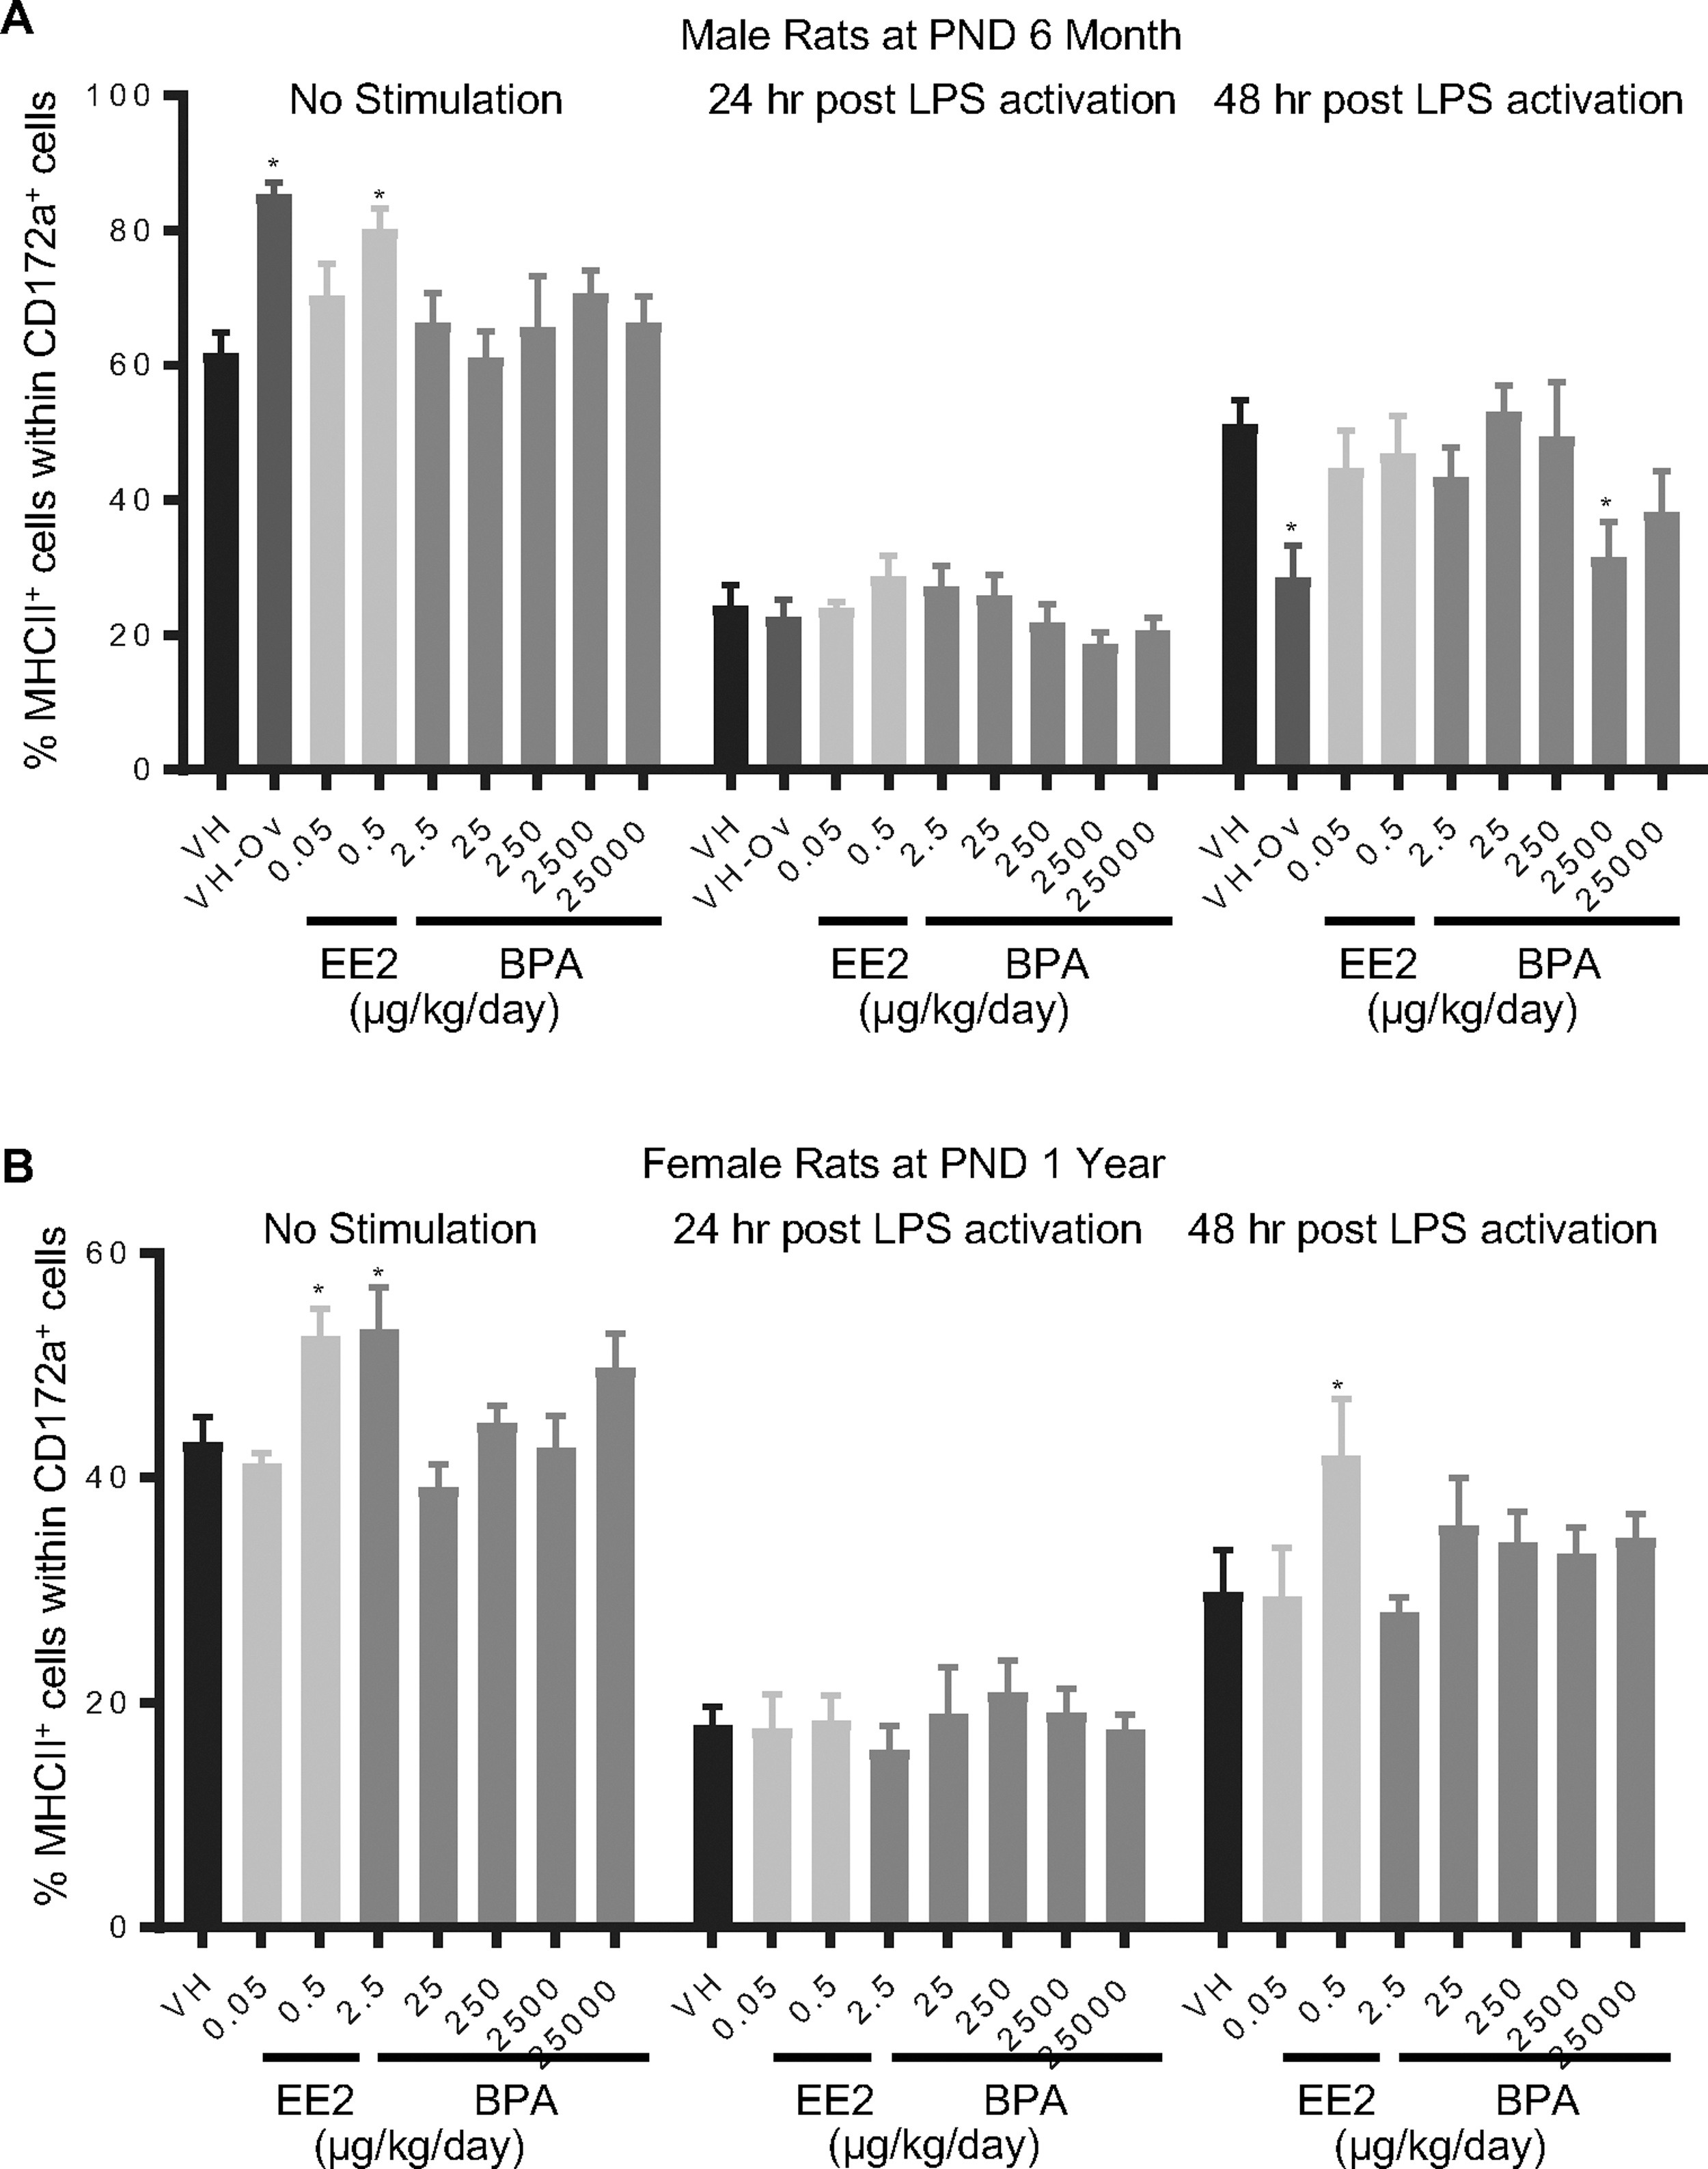
Figure 11. Percentage of MHCII+ monocyte/macrophage/granulocytes post LPS activation by treatment group and sex.
Male (A) and female (B) rats were administered vehicle (VH, 0.3% aqueous carboxymethylcellulose), BPA or estrogen ethinyl estradiol (EE2) at the indicated dose level by oral gavage daily and sacrificed at postnatal day (PND) 6 months (A) and 1 year (B). Splenocytes were isolated and treated with LPS for up to 48 h. The percentage of MHCII+ cells within CD172a+ monocyte/macrophage/granulocytes was quantified by flow cytometry.
Results are presented as mean ± SE. n = 4–10 rats/treatment group/sex. * p < 0.05 when compared to respective vehicle control by a two way ANOVA with Dunnett’s posttest.
- Figure 11 (636 KB)
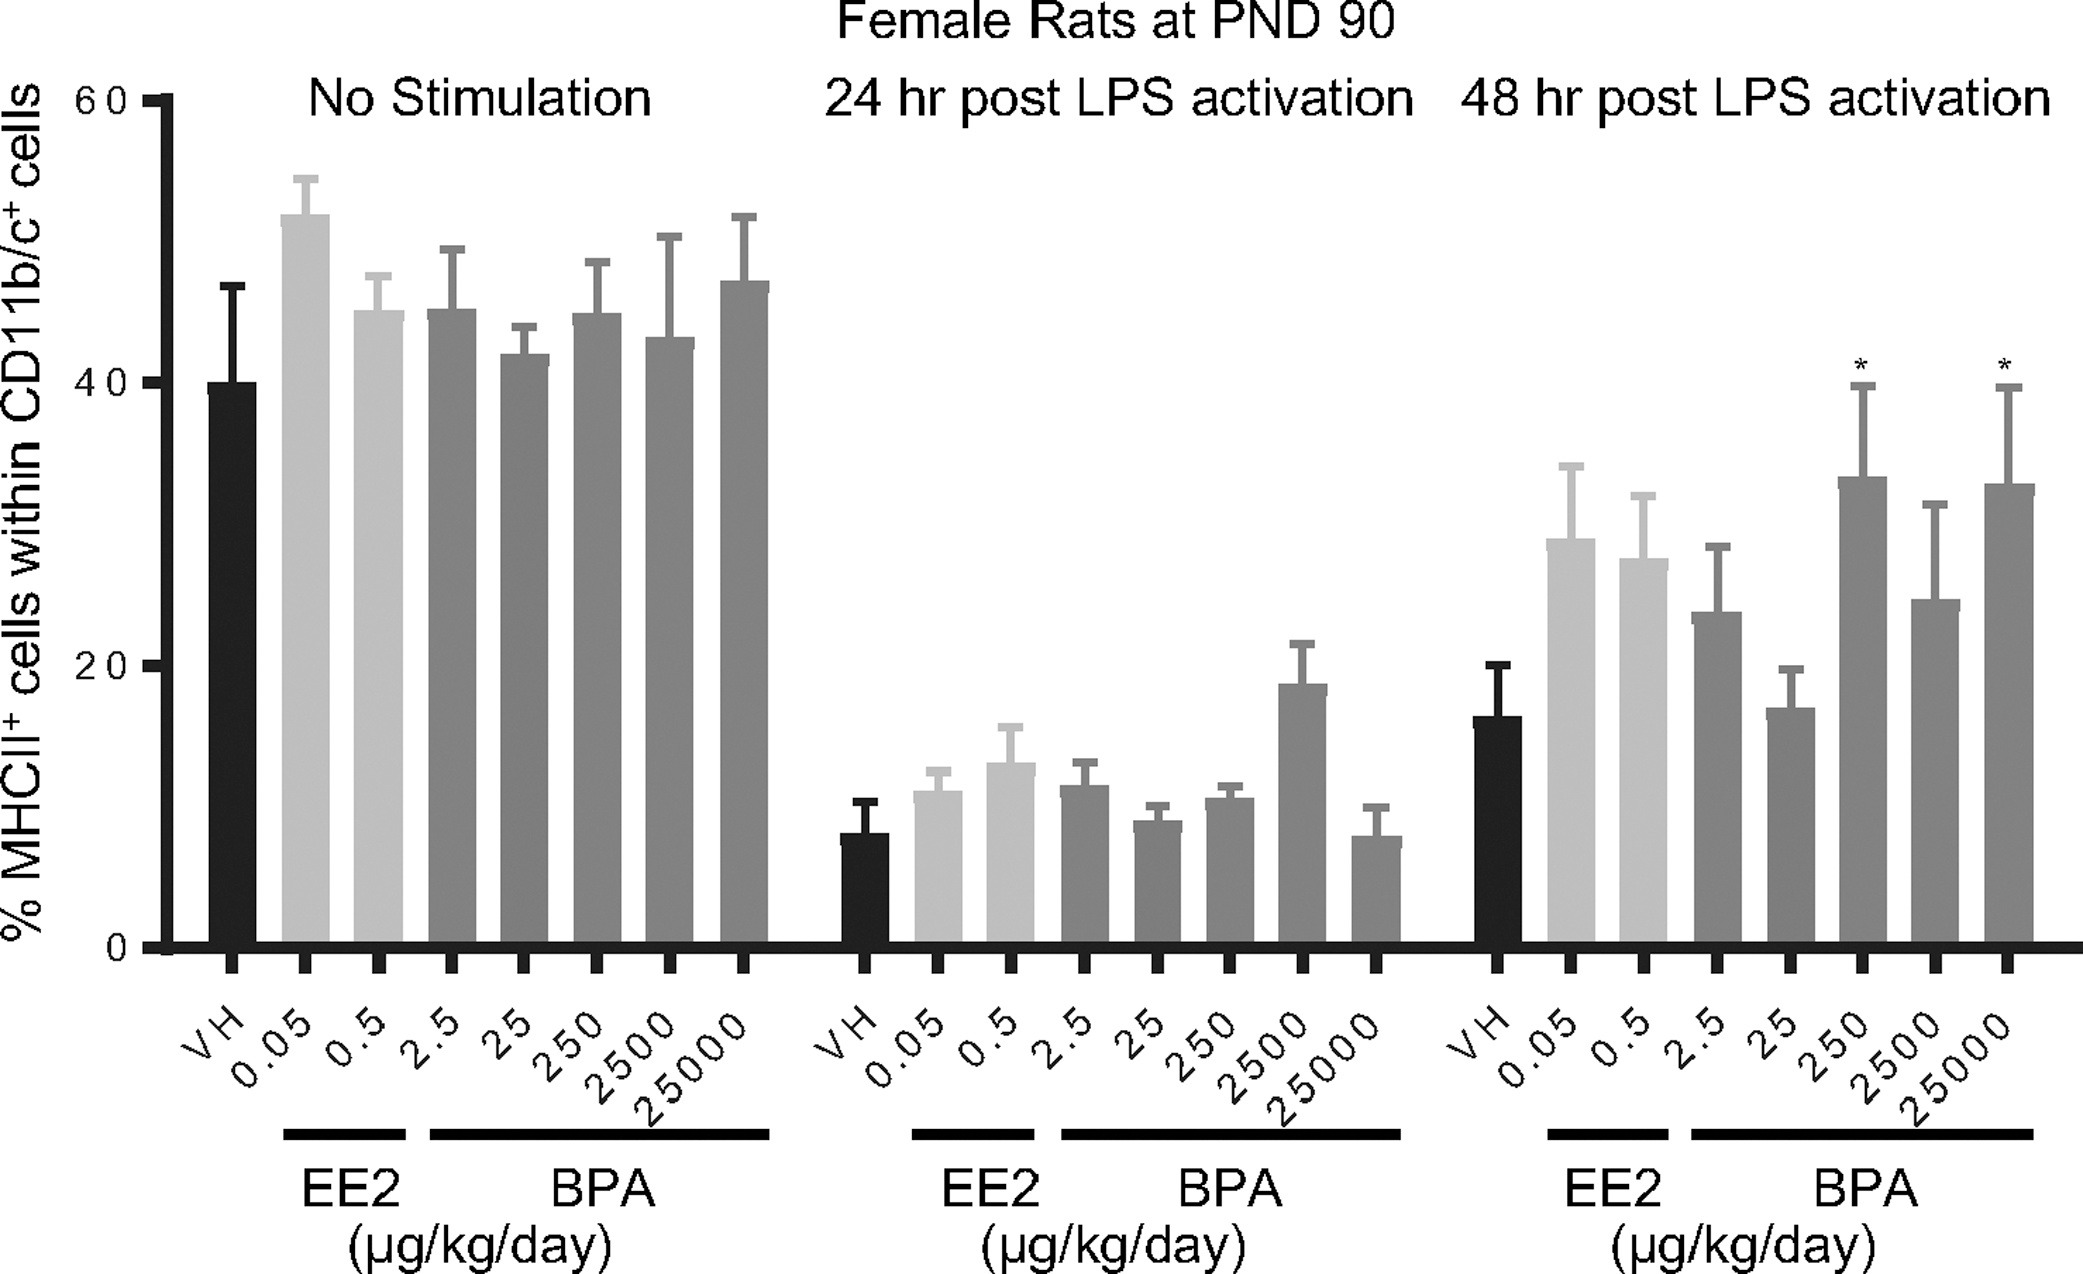
Figure 12. Percentage of MHCII+ macrophage/dendritic cells post LPS activation by treatment group and sex.
Female rats were administered vehicle (VH, 0.3% aqueous carboxymethylcellulose), BPA or estrogen ethinyl estradiol (EE2) at the indicated dose level by oral gavage daily and sacrificed at postnatal day (PND) 90. Splenocytes were isolated and treated with LPS for up to 48 h. The percentage of MHCII+ cells within CD11b/c+ macrophage/dendritic cells was quantified by flow cytometry.
Results are presented as mean ± SE. n = 6–10 rats/treatment group/sex. * p < 0.05 when compared to respective vehicle control by a two way ANOVA with Dunnett’s posttest.
- Figure 12 (246 KB)
Tables
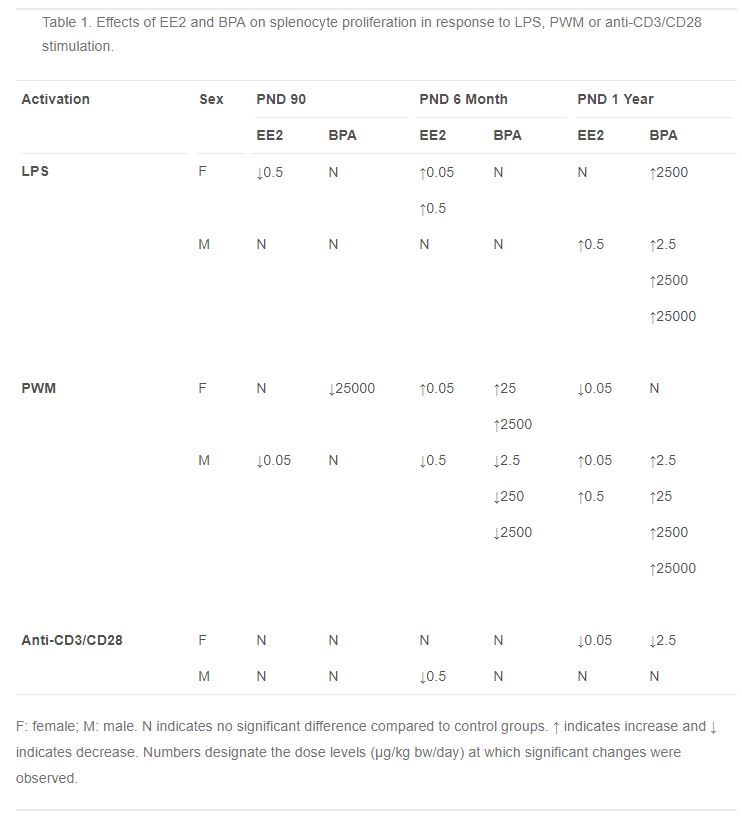
Table 1. Effects of EE2 and BPA on splenocyte proliferation in response to LPS, PWM or anti-CD3/CD28 stimulation.
- Table 1 (54 KB)
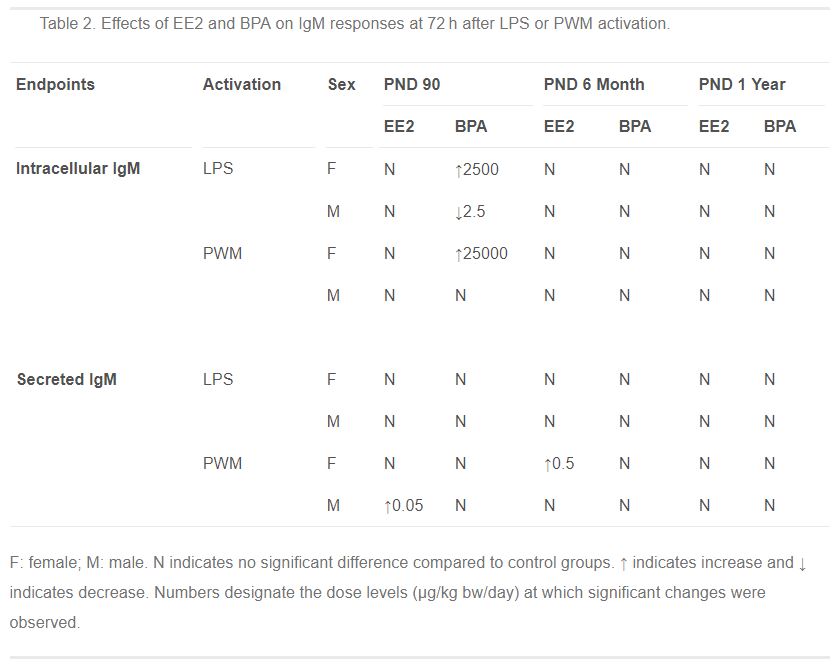
Table 2. Effects of EE2 and BPA on IgM responses at 72 h after LPS or PWM activation.
- Table 2 (57 KB)
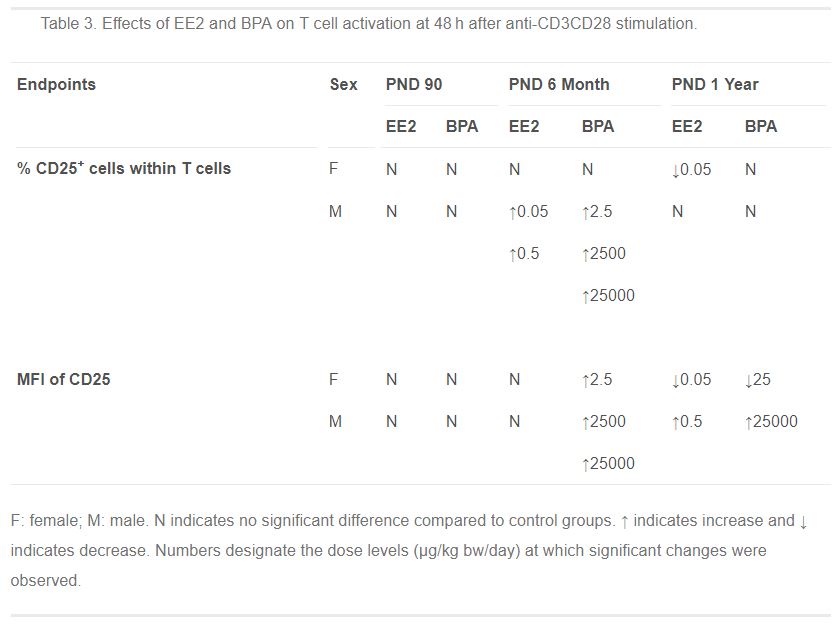
Table 3. Effects of EE2 and BPA on T cell activation at 48 h after anti-CD3CD28 stimulation.
- Table 3 (55 KB)
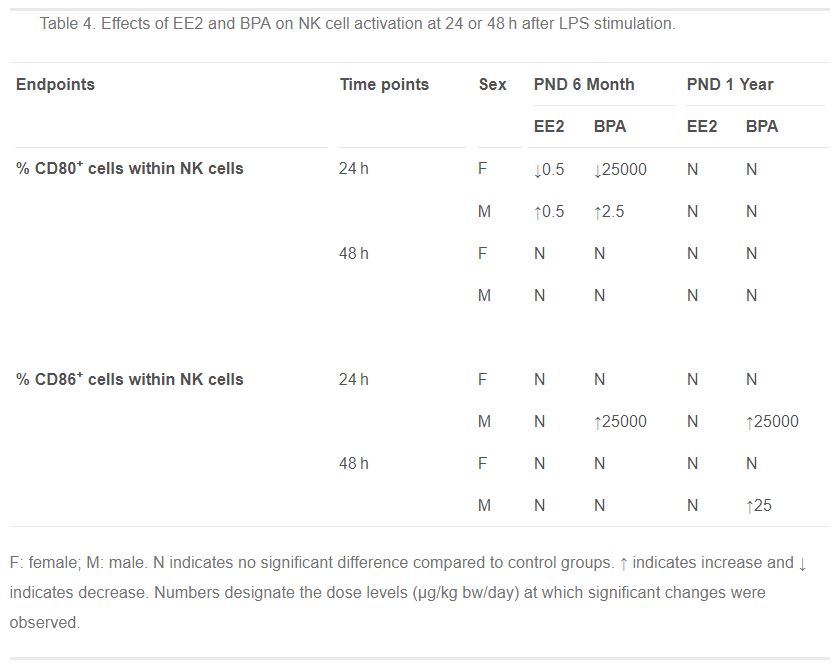
Table 4. Effects of EE2 and BPA on NK cell activation at 24 or 48 h after LPS stimulation.
- Table 4 (56 KB)
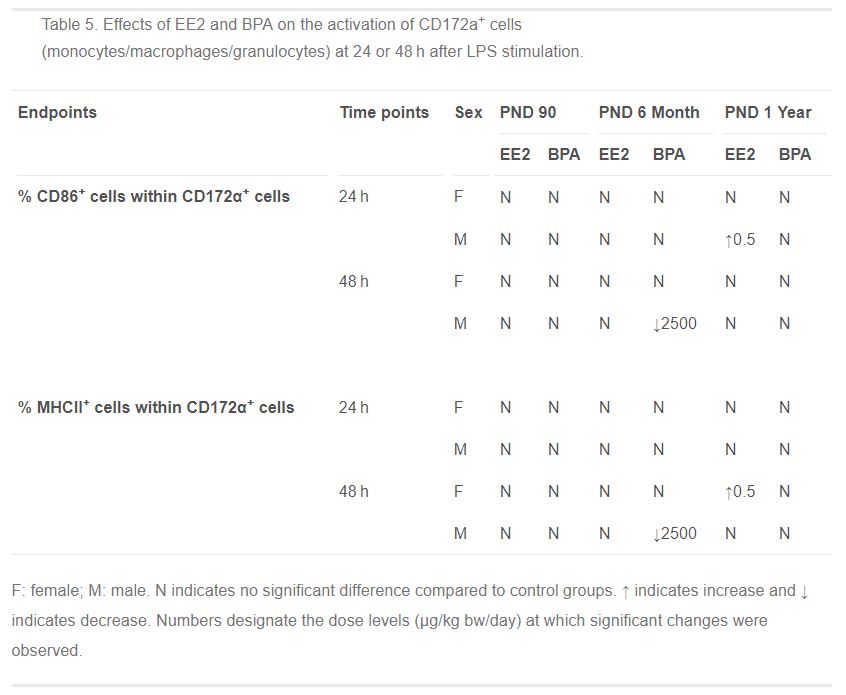
Table 5. Effects of EE2 and BPA on the activation of CD172a+ cells (monocytes/macrophages/granulocytes) at 24 or 48 h after LPS stimulation.
- Table 5 (63 KB)
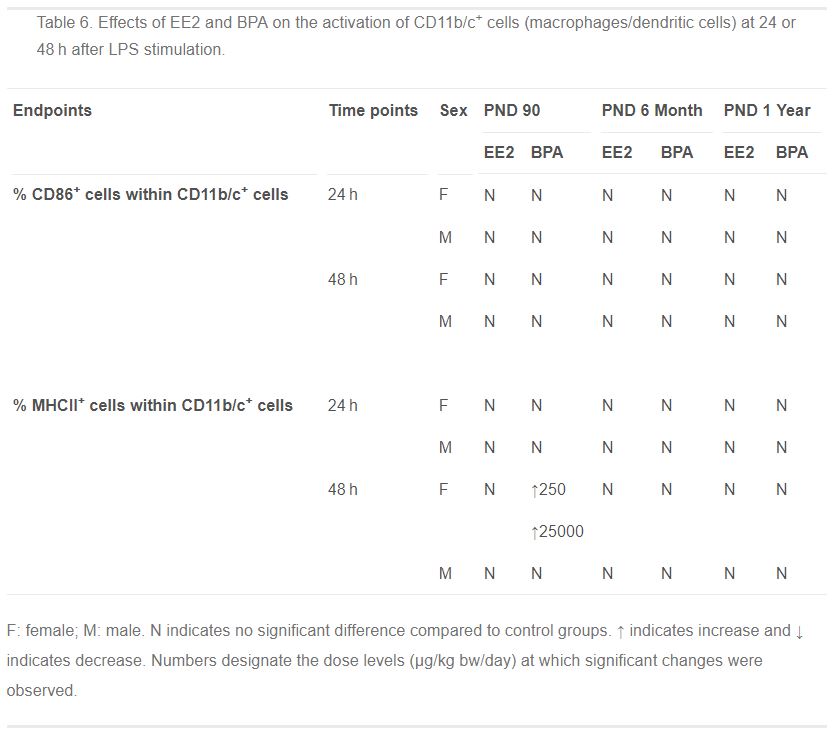
Table 6. Effects of EE2 and BPA on the activation of CD11b/c+ cells (macrophages/dendritic cells) at 24 or 48 h after LPS stimulation.
- Table 6 (62 KB)
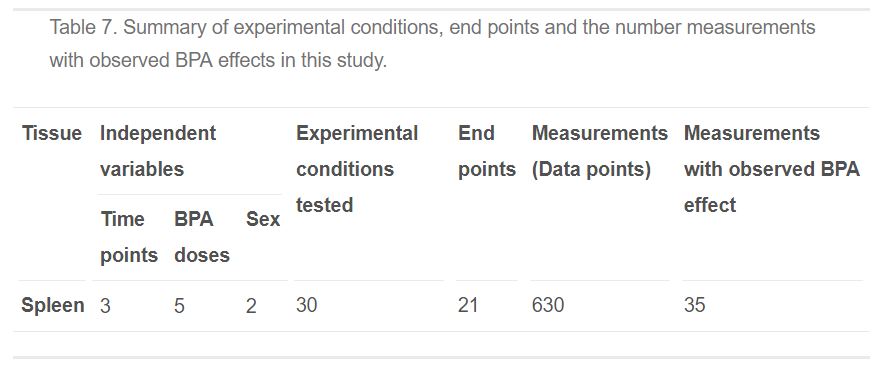
Table 7. Summary of experimental conditions, end points and the number measurements with observed BPA effects in this study.
- Table 7 (43 KB)
Supplemental Materials
Supplementary Data
- Supplement Figure 1-20 (1 MB)