

A high-throughput toxicity screen of 42 per- and polyfluoroalkyl substances (PFAS) and functional assessment of migration and gene expression in human placental trophoblast cells
Bevin E. Blake, Brittany P. Rickard, and Suzanne E. Fenton
DOI:
https://doi.org/10.22427/NTP-DATA-025-00001-0001-000-9
High-Throughput Toxicity Screen
Table 1. Dose-response curve EC50
Dose-response curve EC50 estimates for JEG-3 cell viability, proliferation, and mitochondrial membrane potential (MMP) after 24 hr exposure to PFAS.
- JEG3 PFAS Screen Platemap-01 Manual Data Processing (7 KB)
- JEG3 PFAS Screen Platemap-02 Manual Data Processing (7 KB)
- JEG3 PFAS Screen Platemap-03 Manual Data Processing (7 KB)
- JEG3 PFAS Screen Platemap-04 Manual Data Processing (7 KB)
- JEG3 PFAS Screen Platemaps 1-4 Reps 1-3 (9 KB)
- JEG3 screen R pipeline dataframe shell construction Platemaps 1-4 (3 KB)
- Plate-01 Rep-01 Confluence 0h (4 KB)
- Plate-01 Rep-01 Confluence 24h (4 KB)
- Plate-01 Rep-01 ctg (12 KB)
- Plate-01 Rep-01 jc10 (15 KB)
- Plate-01 Rep-02 Confluence 0h (4 KB)
- Plate-01 Rep-02 Confluence 24h (4 KB)
- Plate-01 Rep-02 ctg (12 KB)
- Plate-01 Rep-02 jc10 (15 KB)
- Plate-01 Rep-03 Confluence 0h (4 KB)
- Plate-01 Rep-03 Confluence 24h (4 KB)
- Plate-01 Rep-03 ctg (12 KB)
- Plate-01 Rep-03 jc10 (15 KB)
- Plate-02 Rep-01 Confluence 0h (4 KB)
- Plate-02 Rep-01 Confluence 24h (4 KB)
- Plate-02 Rep-01 ctg (12 KB)
- Plate-02 Rep-01 jc10 (15 KB)
- Plate-02 Rep-02 Confluence 0h (4 KB)
- Plate-02 Rep-02 Confluence 24h (4 KB)
- Plate-02 Rep-02 ctg (12 KB)
- Plate-02 Rep-02 jc10 (15 KB)
- Plate-02 Rep-03 Confluence 0h (4 KB)
- Plate-02 Rep-03 Confluence 24h (4 KB)
- Plate-02 Rep-03 ctg (12 KB)
- Plate-02 Rep-03 jc10 (15 KB)
- Plate-03 Rep-01 Confluence 0h (4 KB)
- Plate-03 Rep-01 Confluence 24h (3 KB)
- Plate-03 Rep-01 ctg (12 KB)
- Plate-03 Rep-01 jc10 (15 KB)
- Plate-03 Rep-02 Confluence 0h (4 KB)
- Plate-03 Rep-02 Confluence 24h (3 KB)
- Plate-03 Rep-02 ctg (12 KB)
- Plate-03 Rep-02 jc10 (15 KB)
- Plate-03 Rep-03 Confluence 0h (4 KB)
- Plate-03 Rep-03 Confluence 24h (3 KB)
- Plate-03 Rep-03 ctg (12 KB)
- Plate-03 Rep-03 jc10 (15 KB)
- Plate-04 Rep-01 Confluence 0h (4 KB)
- Plate-04 Rep-01 Confluence 24h (4 KB)
- Plate-04 Rep-01 ctg (12 KB)
- Plate-04 Rep-01 jc10 (15 KB)
- Plate-04 Rep-02 Confluence 0h (4 KB)
- Plate-04 Rep-02 Confluence 24h (3 KB)
- Plate-04 Rep-02 ctg (12 KB)
- Plate-04 Rep-02 jc10 (15 KB)
- Plate-04 Rep-03 Confluence 0h (4 KB)
- Plate-04 Rep-03 Confluence 24h (4 KB)
- Plate-04 Rep-03 ctg (13 KB)
- Plate-04 Rep-03 jc10 (15 KB)
- Platemap-01 chemical CAS (10 KB)
- Platemap-01 chemical ID (10 KB)
- Platemap-01 dose concentrations (10 KB)
- Platemap-01 shell (18 KB)
- Platemap-02 chemical CAS (14 KB)
- Platemap-02 chemical ID (14 KB)
- Platemap-02 dose concentrations (10 KB)
- Platemap-02 shell (17 KB)
- Platemap-03 chemical CAS (10 KB)
- Platemap-03 chemical ID (10 KB)
- Platemap-03 dose concentrations (10 KB)
- Platemap-03 shell (18 KB)
- Platemap-04 chemical CAS (10 KB)
- Platemap-04 chemical ID (10 KB)
- Platemap-04 dose concentrations (10 KB)
- Platemap-04 shell (19 KB)
- Work in progress data normalization BEB (13 KB)
Figure 1. Dose-response modeling results
Dose-response modeling results obtained from JEG-3 cells exposed to 42 different PFAS congeners for 24 hours corresponding to (A) viability, (B) proliferation, and (C) mitochondrial membrane potential (MMP).
- Figure 1 (232 KB)
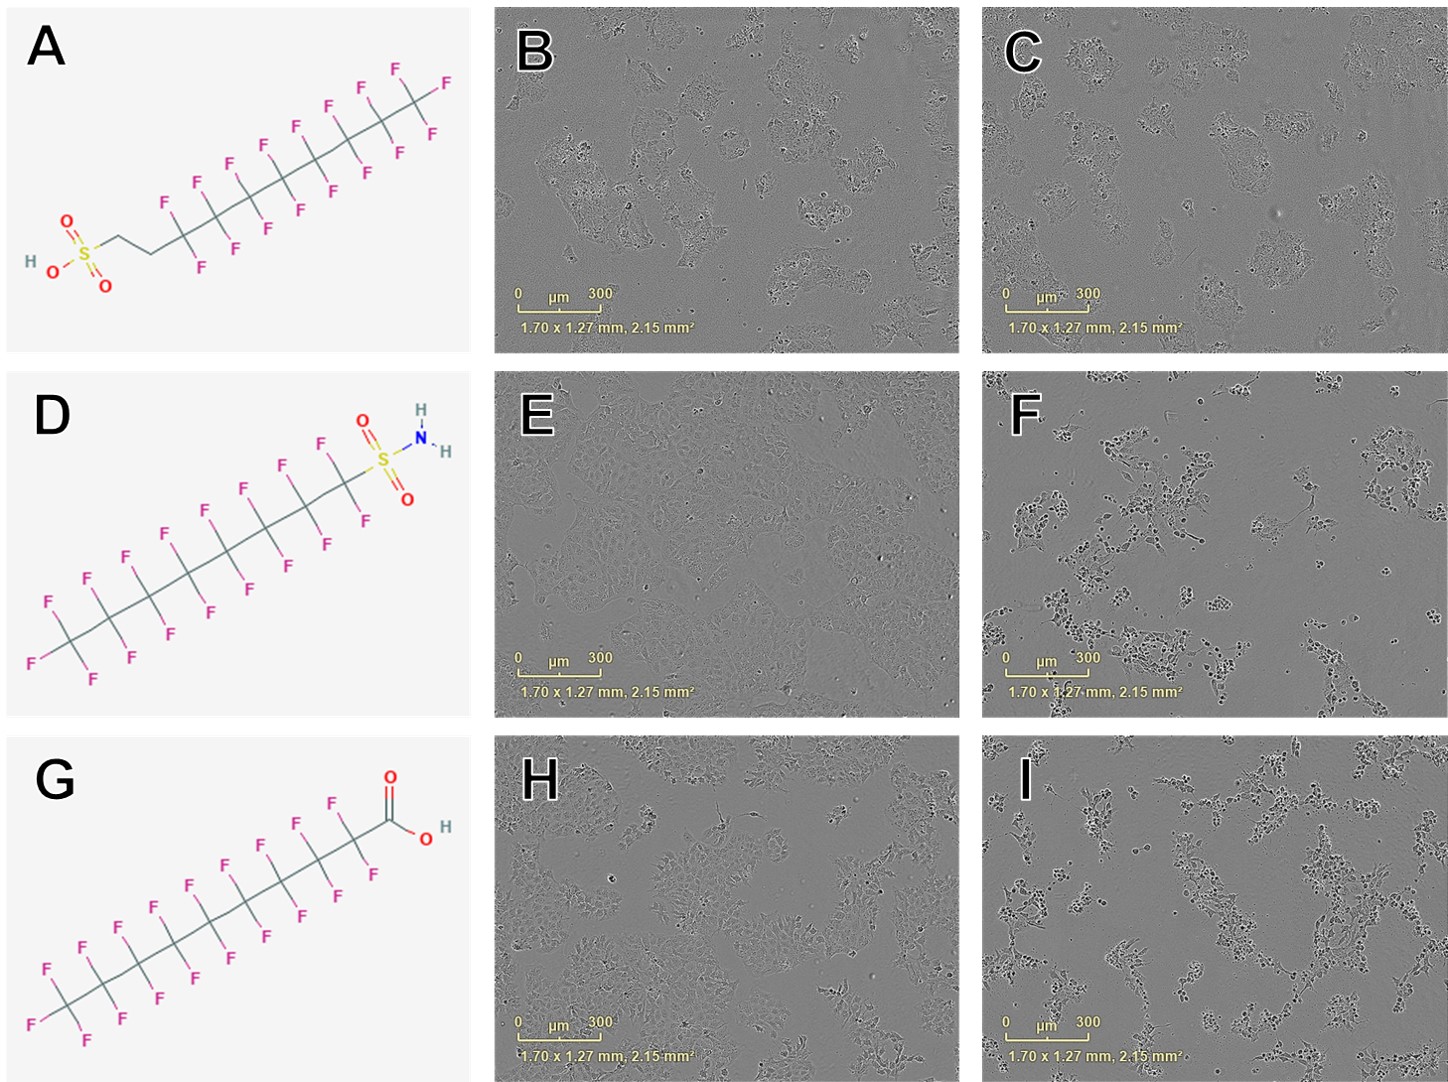
Figure 2. Examples of Chemical Structures and Corresponding Phase Contrast - effects on Cellular Viability
Examples of chemical structures and corresponding phase contrast live cell images obtained from JEG-3 cells after 24 hours exposure to PFAS with most pronounced effects on cellular viability
- Figure 2 (382 KB)
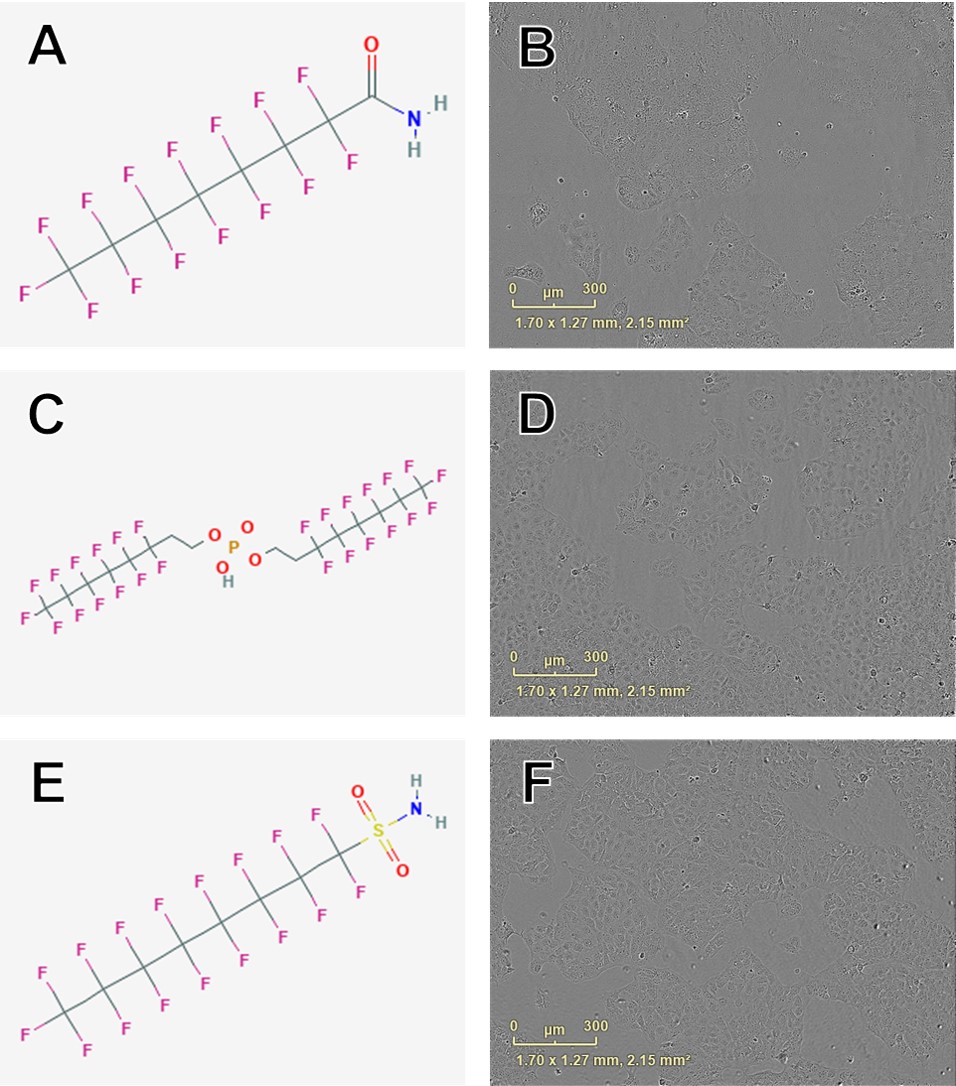
Figure 3. Examples of Chemical Structure and Corresponding Phase Contrast - effects on Cellular Proliferation
Examples of chemical structures and corresponding phase contrast live cell images obtained from JEG-3 cells after 24 hours exposure to PFAS with most pronounced effects on cellular proliferation
- Figure 3 (199 KB)
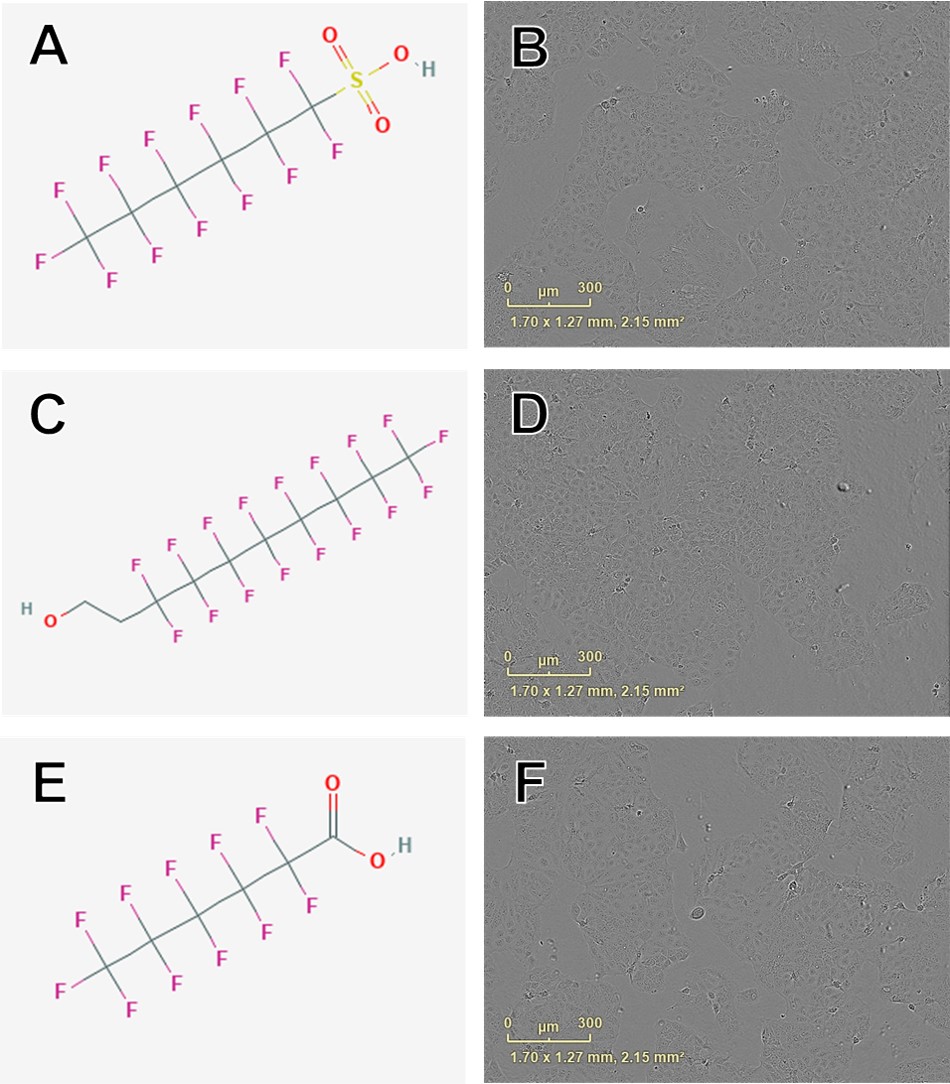
Figure 4. Examples of Chemical Structure and Corresponding Phase Contrast - effects on Mitochondrial Membrane Potential
Examples of chemical structures and corresponding phase contrast live cell images obtained from JEG-3 cells after 24 hours exposure to PFAS with most pronounced effects on mitochondrial membrane potential.
- Figure 4 (186 KB)
Supplementary Table 2. Raw Values for Dose-Response Curve EC50
Raw values for dose-response curve EC50 estimates from JEG-3 cell viability, proliferation, and mitochondrial membrane potential (MMP) assays after exposure to individual PFAS
- Supp TableS2 (61 KB)
Supplementary Table 3. Rough binning of PFAS bioactivity in JEG-3 cells
Rough binning of PFAS bioactivity in JEG-3 cells using lowest concentration (µM) at which the mean response value exceeded the mean control value ± 2*SD
- Supp TableS3 (103 KB)
Supplementary Figure 2. Representative phase contrast live cell images and raw viability relative luminescence units
Representative phase contrast live cell images and raw viability relative luminescence units (RLU) in JEG-3 cells after 24 hours exposure to media only or vehicle control (2% methanol, 98% media)
- Supp FigureS2 (162 KB)
Supplementary Figure 3. Representative images of JEG-3 cells after 24 hours exposure
Representative images of JEG-3 cells after 24 hours exposure to (A) 0 µM, (B) 100 µM, and (C) 150 µM menadione (positive control for cell death).
- Supp FigureS3 (132 KB)
Supplementary Figure 4.Dose-response model fits for cell viability after 24 hours exposure to PFAS
Dose-response model fits for cell viability after 24 hours exposure to PFAS. CAS numbers are shown in the grey header of individual plots.
- Supp FigureS4 (188 KB)
Supplementary Figure 5. Dose-response model fits for cell proliferation after 24 hours exposure to PFAS
Dose-response model fits for cell proliferation after 24 hours exposure to PFAS. CAS numbers are shown in the grey header of individual plots.
- Supp FigureS5 (185 KB)
Supplementary Figure 6. Dose-response model fits for cell mitochondrial membrane potential
Dose-response model fits for cell mitochondrial membrane potential (MMP) after 24 hours exposure to PFAS.
- Supp FigureS6 (183 KB)
Scratch Wound/Migration Assay
Figure 5. JEG-3 cell migration after 24 hours of exposure to select PFAS
. JEG-3 cell migration after 24 hours of exposure to select PFAS, assessed using a scratch wound assay (pictured in Figure S6).
- Figure 5 (112 KB)
Supplementary Figure 7. Effects of PFAS on JEG-3 cell migration
Effects of PFAS on JEG-3 cell migration during wound healing after 0, 18, 36, and 72 hours of exposure.
- Supp FigureS7 (175 KB)
Supplementary Figure 8. JEG-3 cell migration
JEG-3 cell migration after 48 hours of exposure to select PFAS, assessed using a scratch wound assay
- Supp FigureS8 (37 KB)
Supplementary Figure 9. JEG-3 cell migration after 72 hours of Exposure
JEG-3 cell migration after 72 hours of exposure to select PFAS, assessed using a scratch wound assay.
- JEG-3 Migration Data BPR (48 KB)
- Supp FigureS9 (158 KB)
NanoString Gene Expression
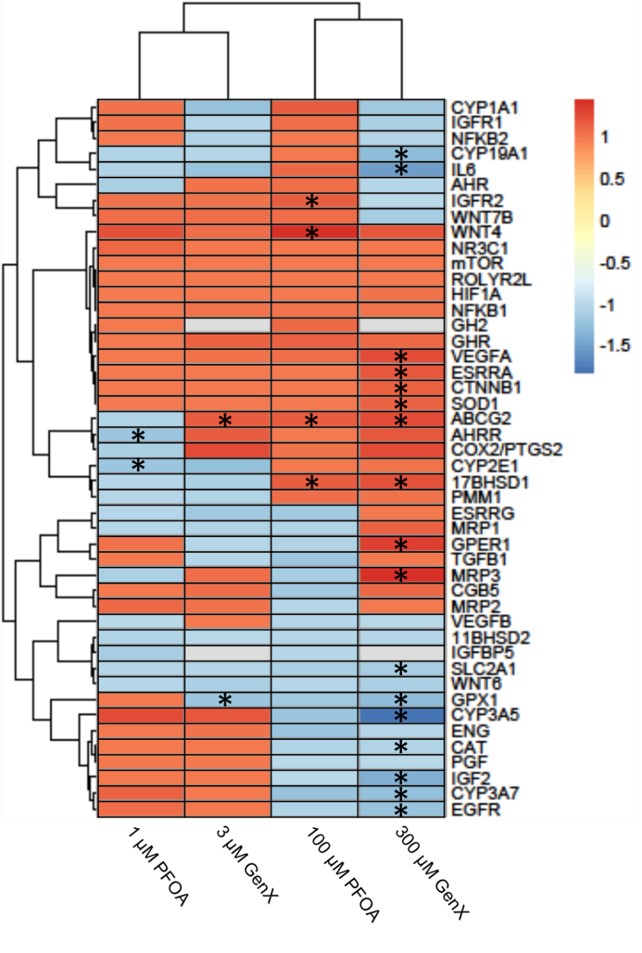
NanoString heatmap
Figure 6. Heatmap illustrating gene expression changes in a set of 46 genes evaluated in JEG-3 cells after exposure to PFOA or GenX for 24 hours.
- Figure 6 (130 KB)
- Gene expression data nanostring analysis BEB (40 KB)
- Gene expression data Nanostring BEB (5 KB)
NanoString data
Spplementary Table 4. Gene expression data expressed as fold change over untreated control from JEG-3 cells after exposure to PFOA or GenX
- ANOVA JEG3 GenX 09 13 18 44 (28 KB)
- ANOVA JEG3 PFOA 09 13 18 46 (24 KB)
- N92 JEG3 nSadjusted data 09 13 18 Counts (12 KB)
- N92 JEG3 nSadjusted data 09 13 18 log2 qN (17 KB)
- N92 JEG3 raw data 09 13 18 (20 KB)
- Supp TableS4 (80 KB)
Supplemental Information
Supplementary Figure 1. Experimental workflow
Experimental workflow to conduct efficient high-throughput toxicity screening of PFAS using JEG-3 cells
- Supp FigureS1 (364 KB)
Supplementary Table 1. List of PFAS tested
List of PFAS tested in the JEG-3 placental cell line, and their unique identifiers, molecular formulas and weights.
- Supp TableS1 (93 KB)