

Transcriptional pathways linked to fetal and maternal hepatic dysfunction caused by gestational exposure to perfluorooctanoic acid (PFOA) or hexafluoropropylene oxide-dimer acid (HFPO-DA or GenX) in CD-1 mice
Bevin E. Blake, Colette N. Miller, Helen Nguyen, Vesna A. Chappell, Trina P. Phan, Dhiral P. Phadke, Michele R. Balik-Meisner, Deepak Mav, Ruchir R. Shah, Suzanne E. Fenton
Publication
Publication
Ecotoxicology and Environmental Safety DOI: https://doi.org/10.1016/j.ecoenv.2022.114314
DOI:
https://doi.org/10.22427/NTP-DATA-021-00006-0002-0000-1
PMID: 36436258
PMCID: PMC9742811
NCBI GEO Accession number GSE199233
email link: CEBS-Support
Abstract
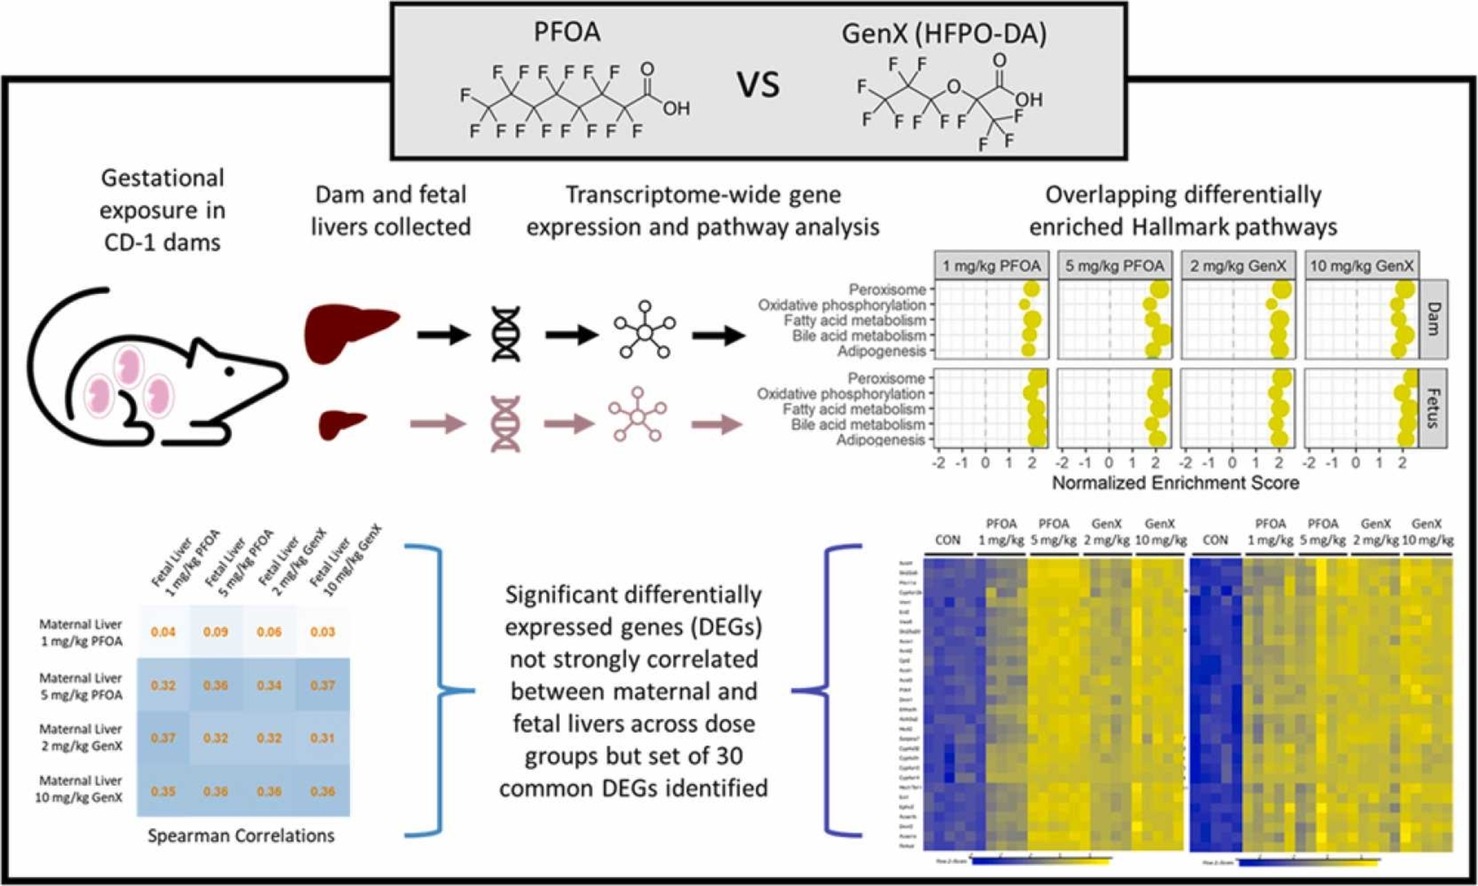
Per- and polyfluoroalkyl substances (PFAS) comprise a diverse class of chemicals used in industrial processes, consumer products, and fire-fighting foams which have become environmental pollutants of concern due to their persistence, ubiquity, and associations with adverse human health outcomes, including in pregnant persons and their offspring. Multiple PFAS are associated with adverse liver outcomes in adult humans and toxicological models, but effects on the developing liver are not fully described. Here we performed transcriptomic analyses in the mouse to investigate the molecular mechanisms of hepatic toxicity in the dam and its fetus after exposure to two different PFAS, perfluorooctanoic acid (PFOA) and its replacement, hexafluoropropylene oxide-dimer acid (HFPO-DA, known as GenX). Pregnant CD-1 mice were exposed via oral gavage from embryonic day (E) 1.5–17.5 to PFOA (0, 1, or 5 mg/kg-d) or GenX (0, 2, or 10 mg/kg-d). Maternal and fetal liver RNA was isolated (N = 5 per dose/group) and the transcriptome analyzed by Affymetrix Array. Differentially expressed genes (DEG) and differentially enriched pathways (DEP) were obtained. DEG patterns were similar in maternal liver for 5 mg/kg PFOA, 2 mg/kg GenX, and 10 mg/kg GenX (R2: 0.46–0.66). DEG patterns were similar across all 4 dose groups in fetal liver (R2: 0.59–0.81). There were more DEGs in fetal liver compared to maternal liver at the low doses for both PFOA (fetal = 69, maternal = 8) and GenX (fetal = 154, maternal = 93). Upregulated DEPs identified across all groups included Fatty Acid Metabolism, Peroxisome, Oxidative Phosphorylation, Adipogenesis, and Bile Acid Metabolism. Transcriptome-phenotype correlation analyses demonstrated > 1000 maternal liver DEGs were significantly correlated with maternal relative liver weight (R2 >0.92). These findings show shared biological pathways of liver toxicity for PFOA and GenX in maternal and fetal livers in CD-1 mice. The limited overlap in specific DEGs between the dam and fetus suggests the developing liver responds differently than the adult liver to these chemical stressors. This work helps define mechanisms of hepatic toxicity of two structurally unique PFAS and may help predict latent consequences of developmental exposure.
Graphical Abstract
Tables
Table 1. Number of significant differentially expressed genes (DEGs) in maternal and fetal liver following exposure to PFOA or GenX.
NCBI GEO Accession number GSE199233
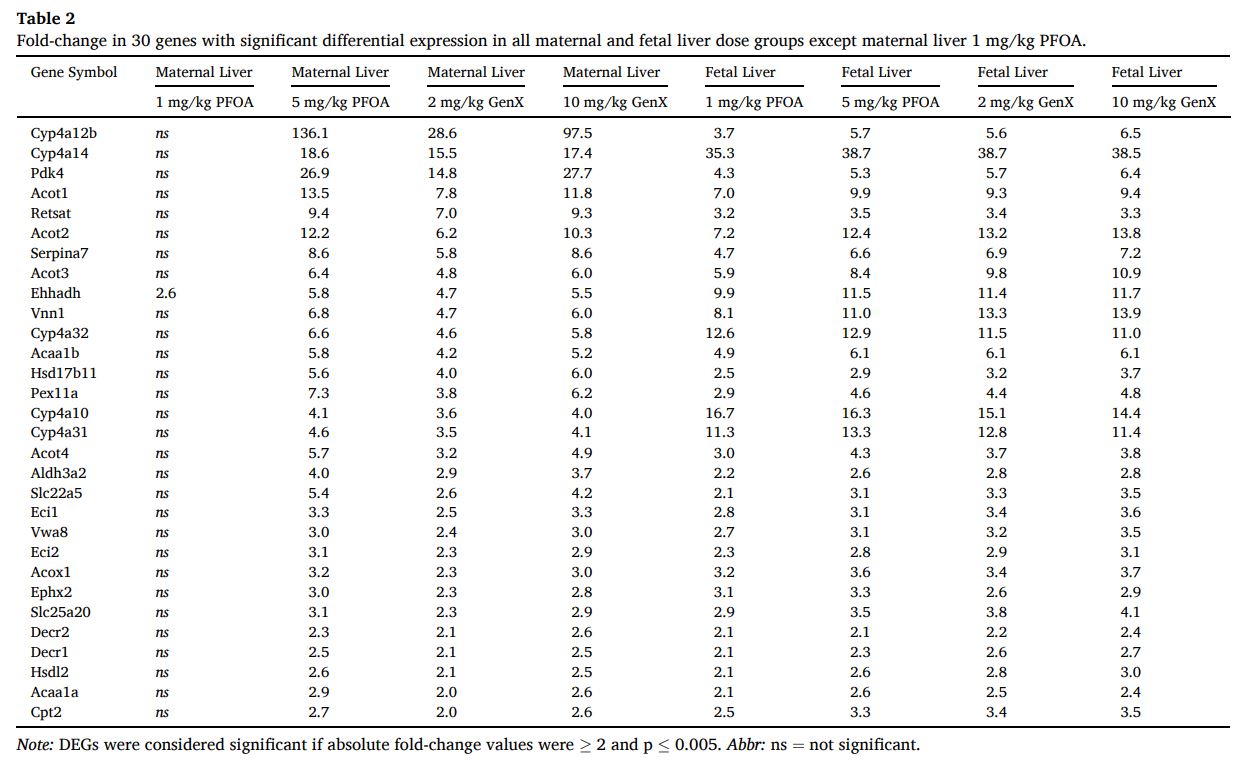
Table 2. Fold-change in 30 genes with significant differential expression in all maternal and fetal liver dose groups except maternal liver 1 mg/kg PFOA.
NCBI GEO Accession number GSE199233
Table 3. Transcriptome-wide transcript-phenotype correlation analysis of maternal liver gene expression and relevant phenotypic endpoints.
- Blake et al. 2022 Ecotox Table 3 (103 KB)
- Combined necropsy data E11.5 and E17.5 updated (16 KB)
- R format CBC and clin path data pregnant dams only (8 KB)
- Supplemental Table 6 (3 MB)
Figures
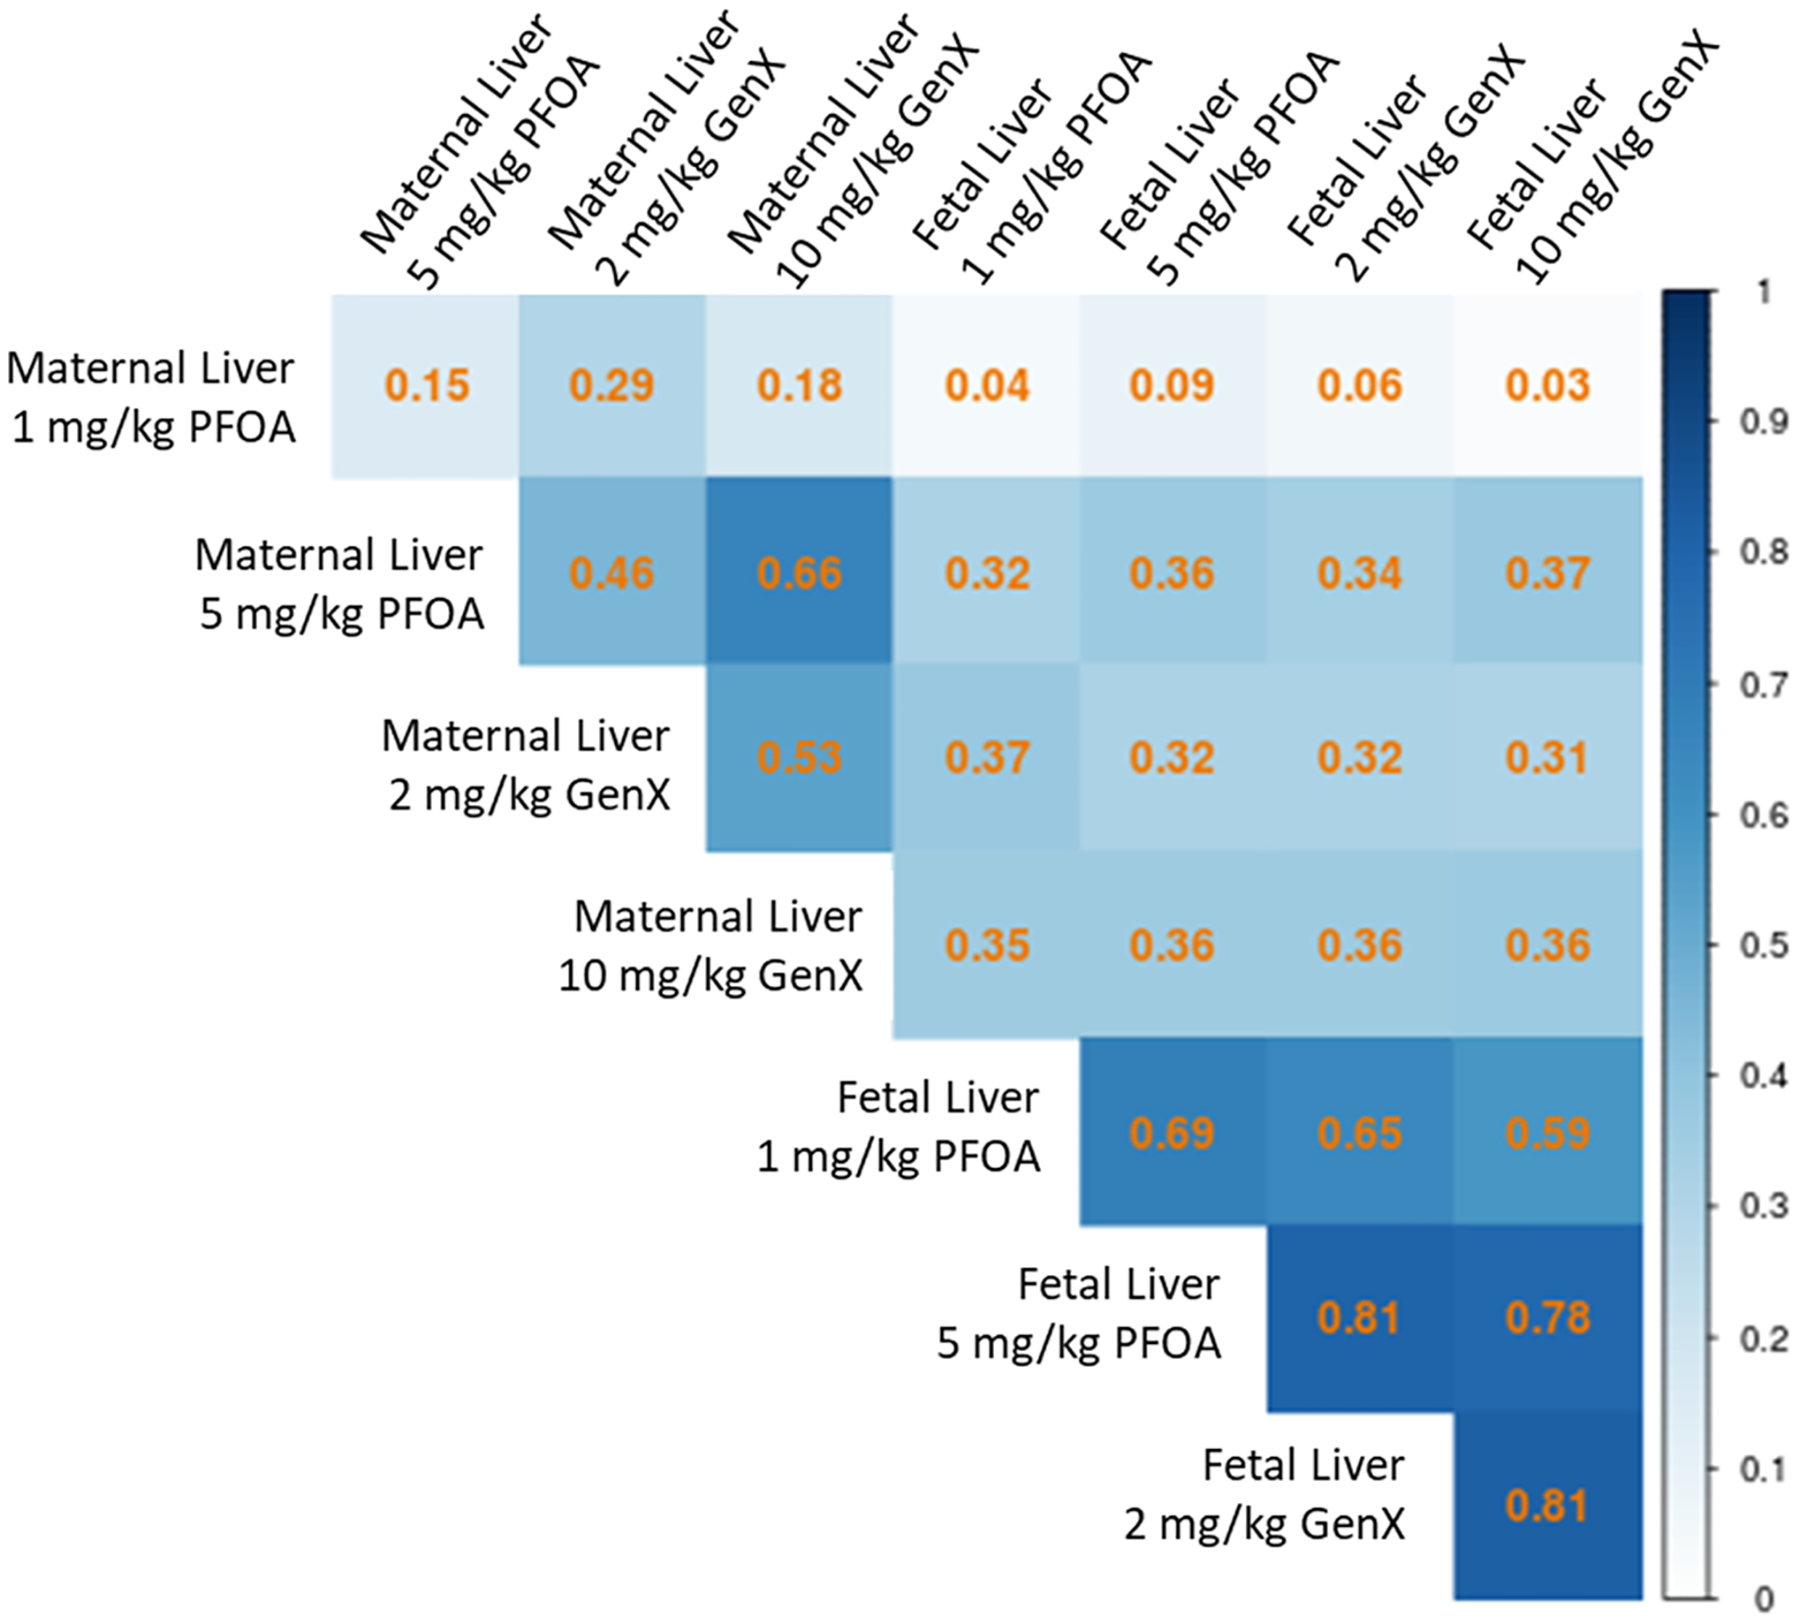
Figure 1. Matthews correlation coefficient plot demonstrating similarity between significant DEGs (shown in Table 1) across the four dose conditions for maternal and fetal liver.
Gene expression changes tended to be more similar across dose groups in fetal liver (0.59–0.81) than across dose groups in maternal liver (0.15–0.66). Correlation coefficients between maternal and fetal liver across the dose conditions were least similar when comparing fetal dose groups to maternal 1 mg/kg PFOA (0.03–0.09) whereas all other correlation permutations were comparable (0.31–0.37).
NCBI GEO Accession number GSE199233
- Blake et al. 2022 Ecotox Figure 1 (555 KB)
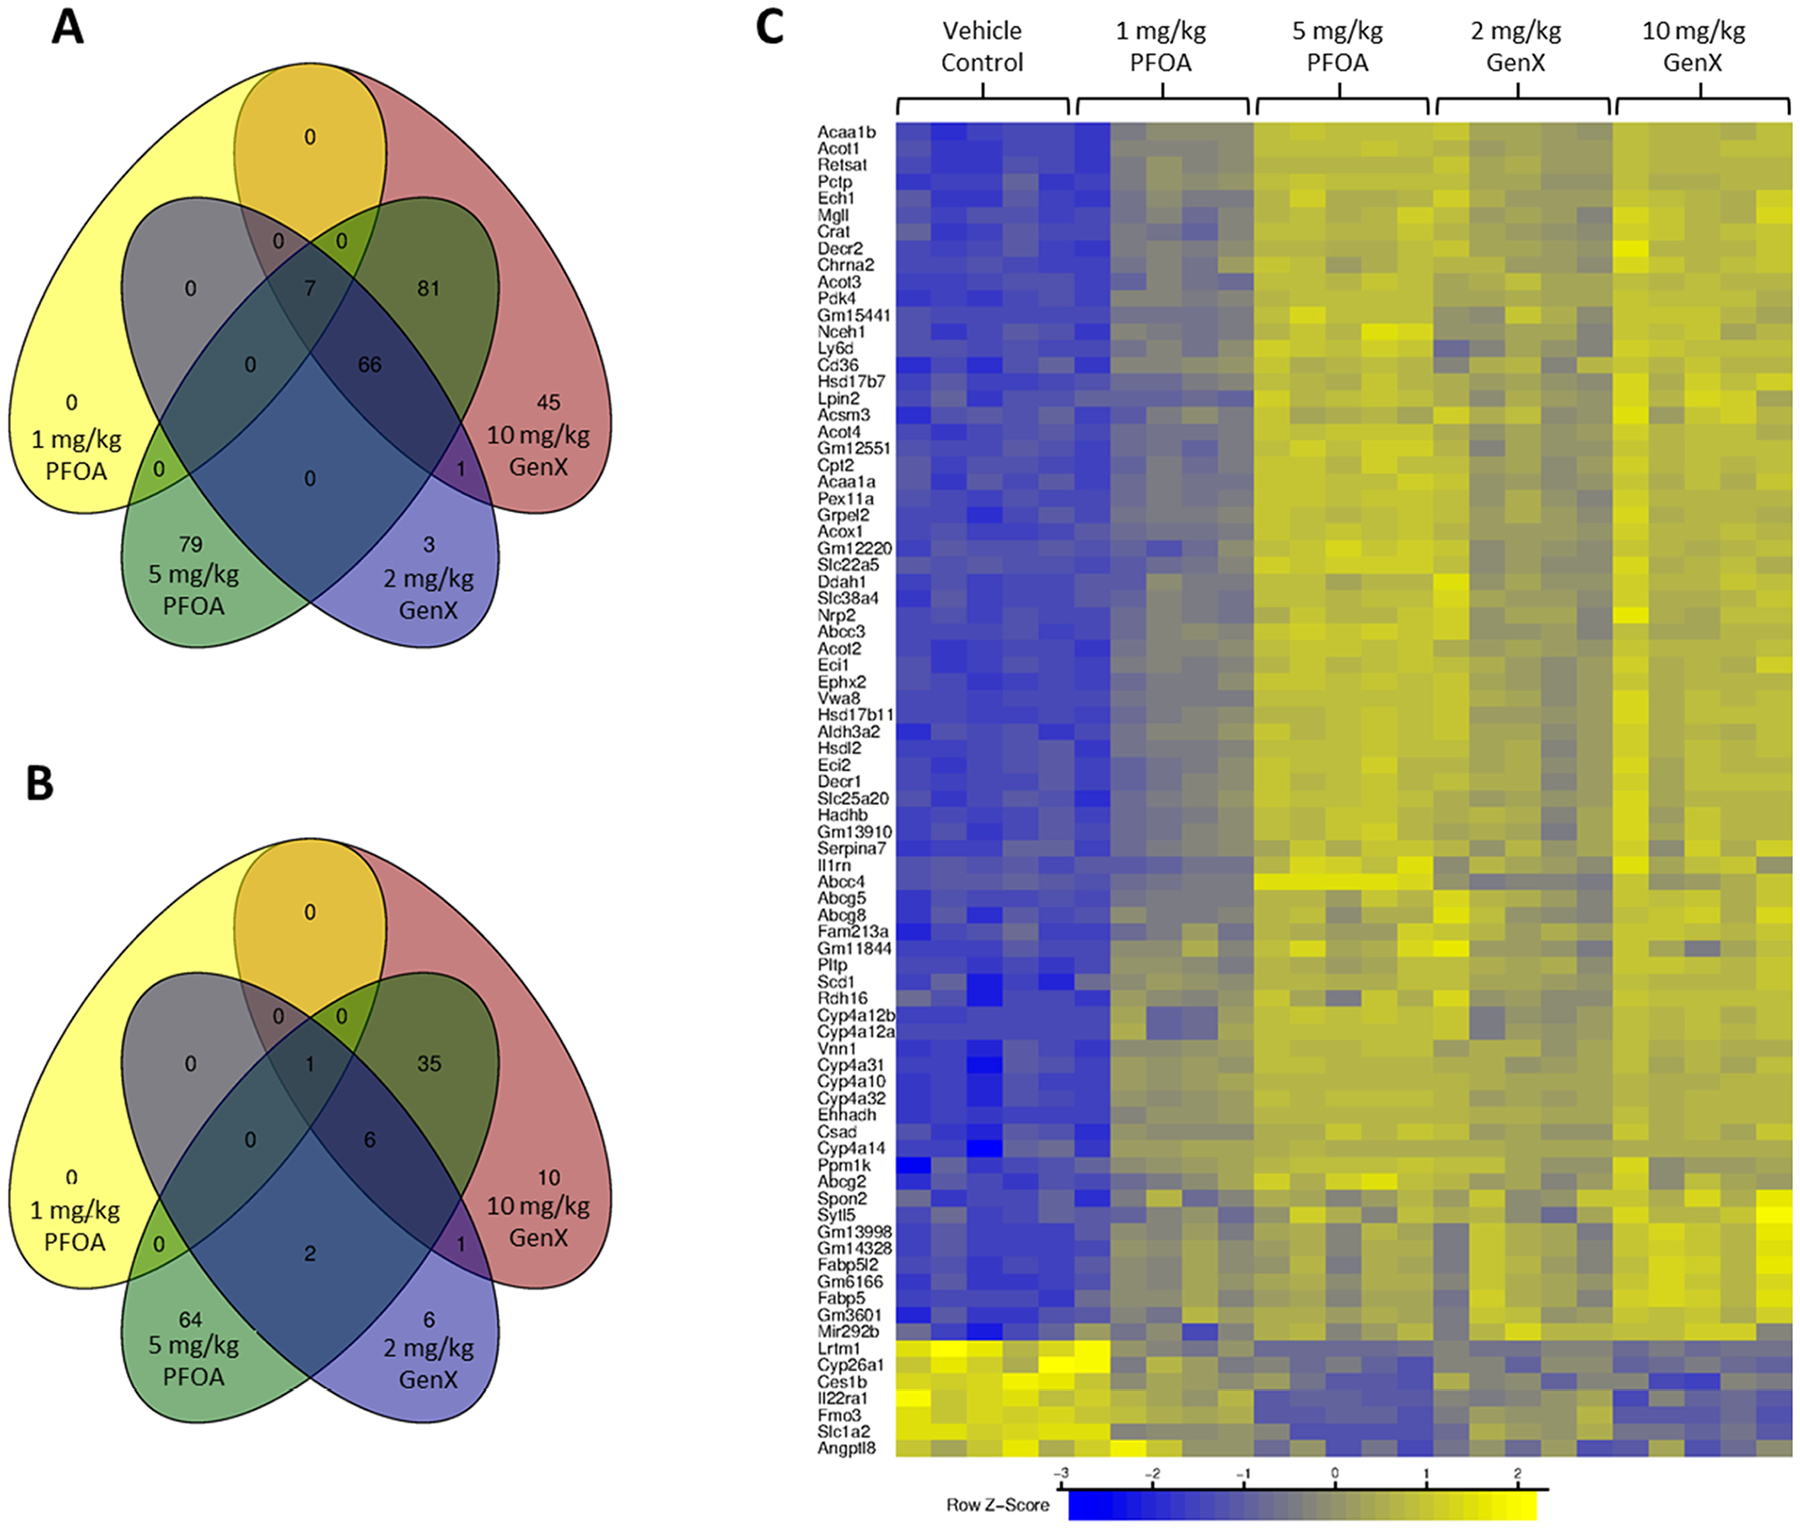
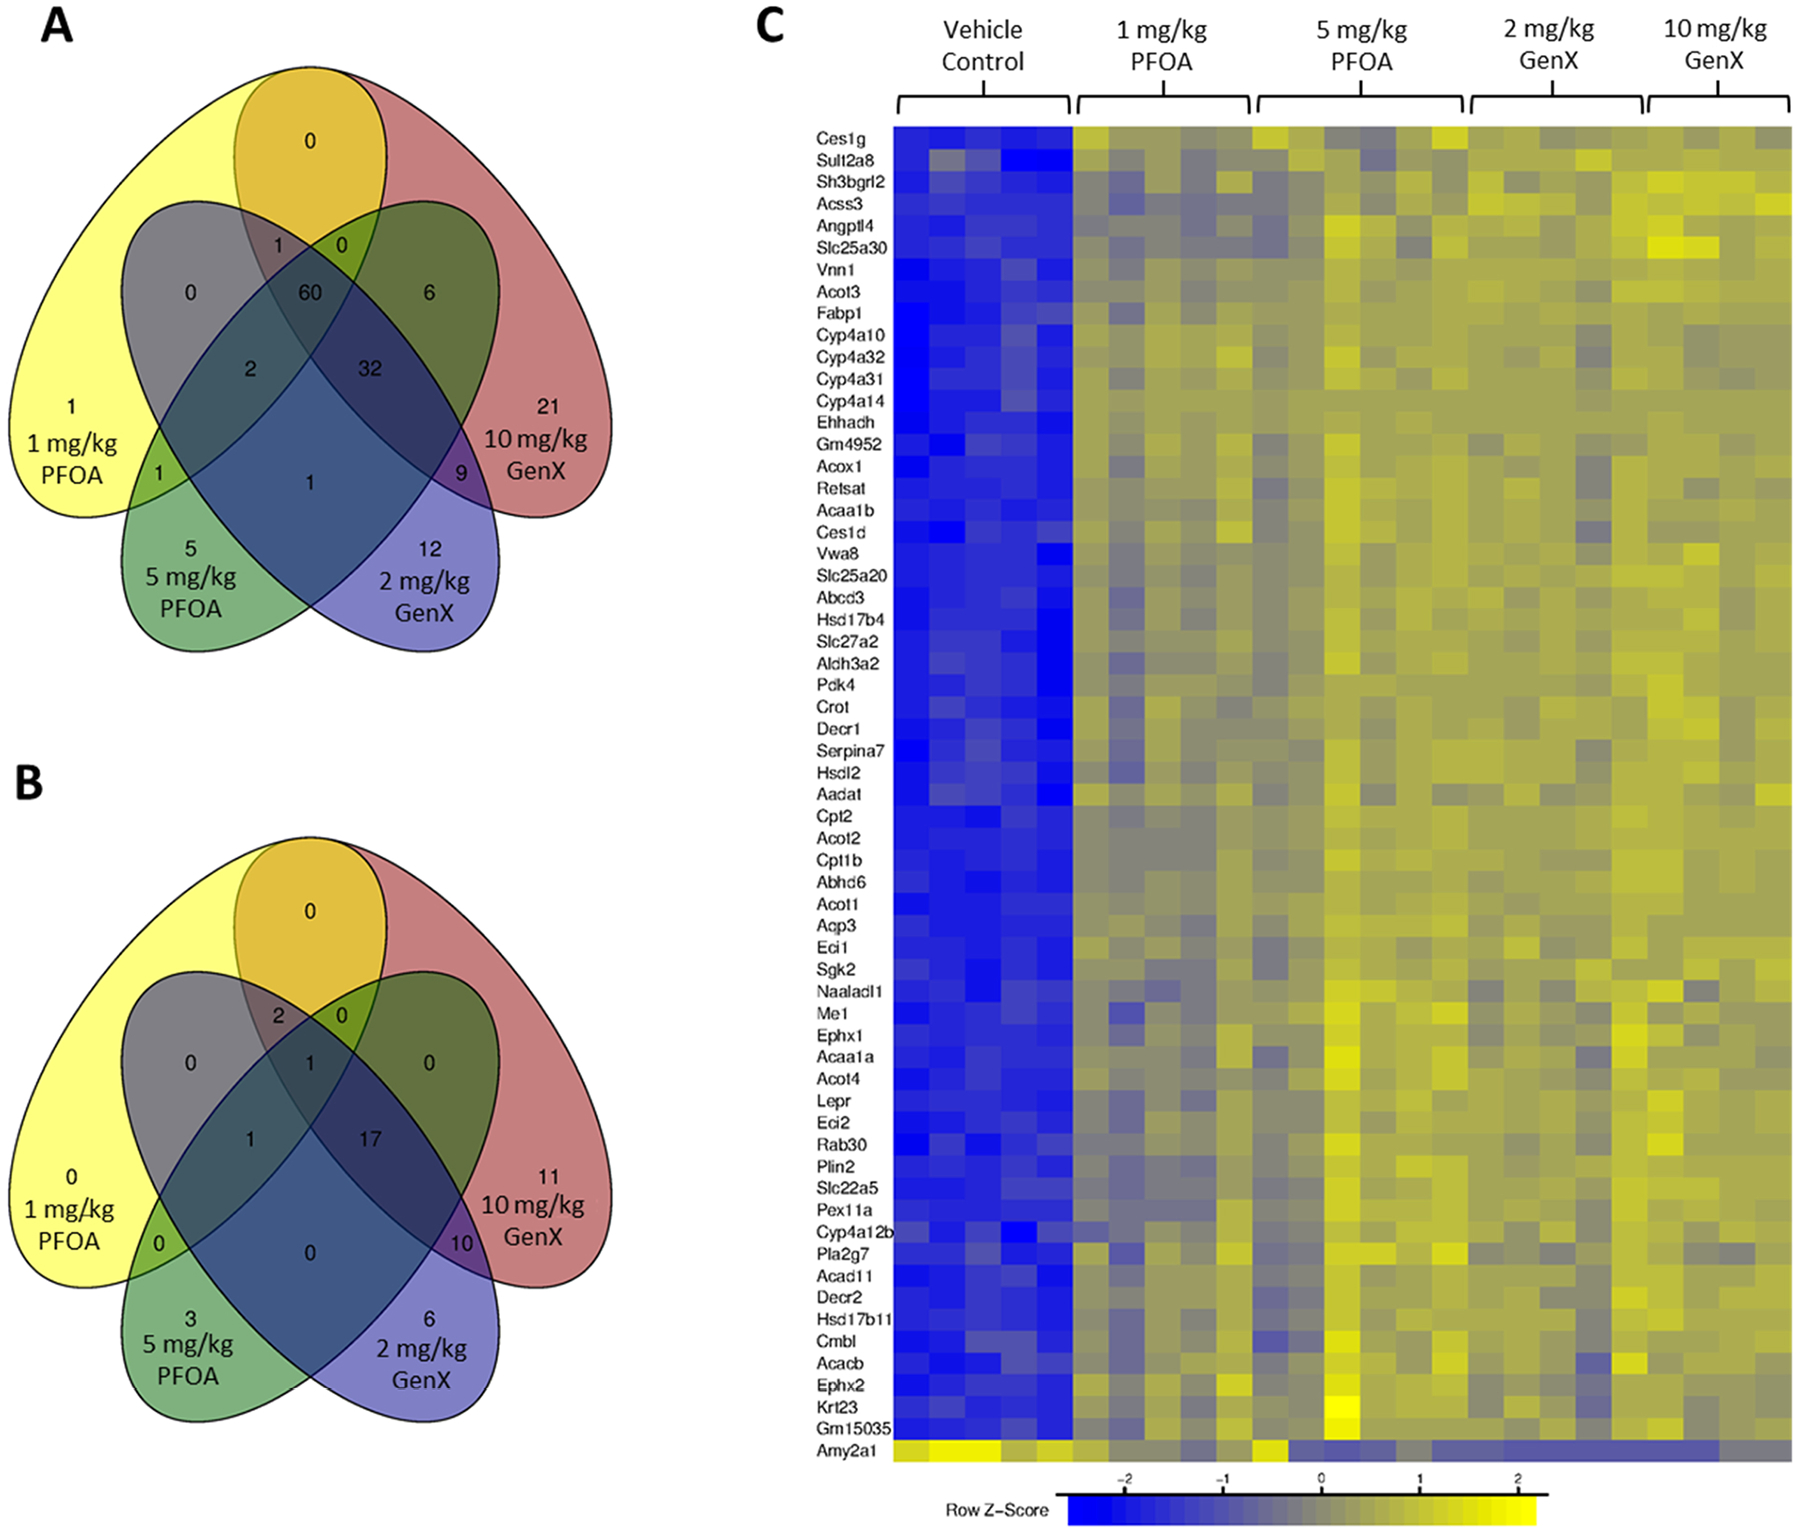
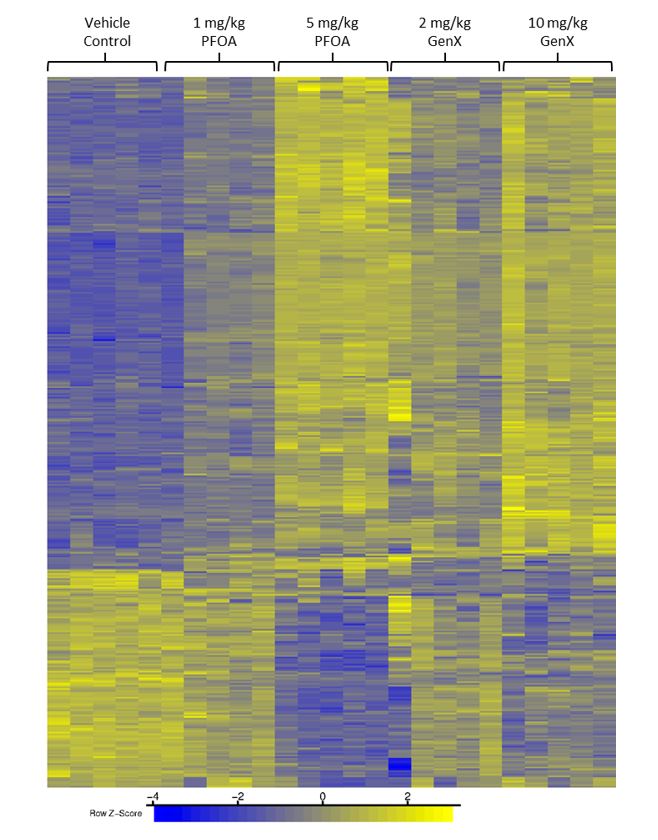
Figure 2. Differentially expressed genes (DEGs) in maternal liver after gestational exposure to PFOA (1 and 5 mg/kg) or GenX (2 and 10 mg/kg).
(A) Overlapping upregulated DEGs and (B) overlapping downregulated DEGs are shown in the Venn diagrams. (C) Heatmap showing row z-score of the normalized expression values for 80 genes significantly altered in the 5 mg/kg PFOA, 2 mg/kg GenX, and 10 mg/kg GenX exposure groups where each column represents an individual animal to highlight biologic variability within a given treatment group. Three non-coding genes were identified and include Gm11844, Gm15441, and Mir292b. DEGs were considered significant if absolute fold-change values were ≥ 2 and p ≤ 0.005.
NCBI GEO Accession number GSE199233
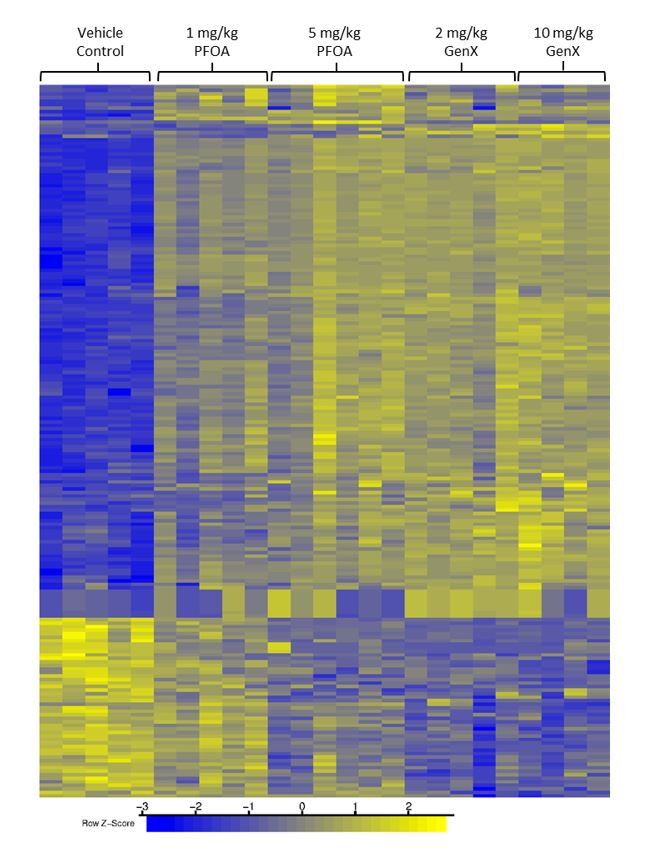
Figure 3. Differentially expressed genes (DEGs) in fetal liver after in utero exposure to PFOA (1 and 5 mg/kg) or GenX (2 and 10 mg/kg).
(A) Overlapping upregulated DEGs and (B) overlapping downregulated DEGs are shown in the Venn diagrams. (C) Heatmap showing row z-score of the normalized expression values for 61 genes significantly altered in altered in all four exposure groups where each column represents an individual animal to highlight biologic variability within a given treatment group. One non-coding gene, Gm15035, was identified as a DEG across all treatment groups and one additional non-coding gene, 1300002E11Rik, was identified as a DEG across all treatment groups except 1 mg/kg PFOA. DEGs were considered significant if absolute fold-change values were ≥ 2 and p ≤ 0.005.
NCBI GEO Accession number GSE199233
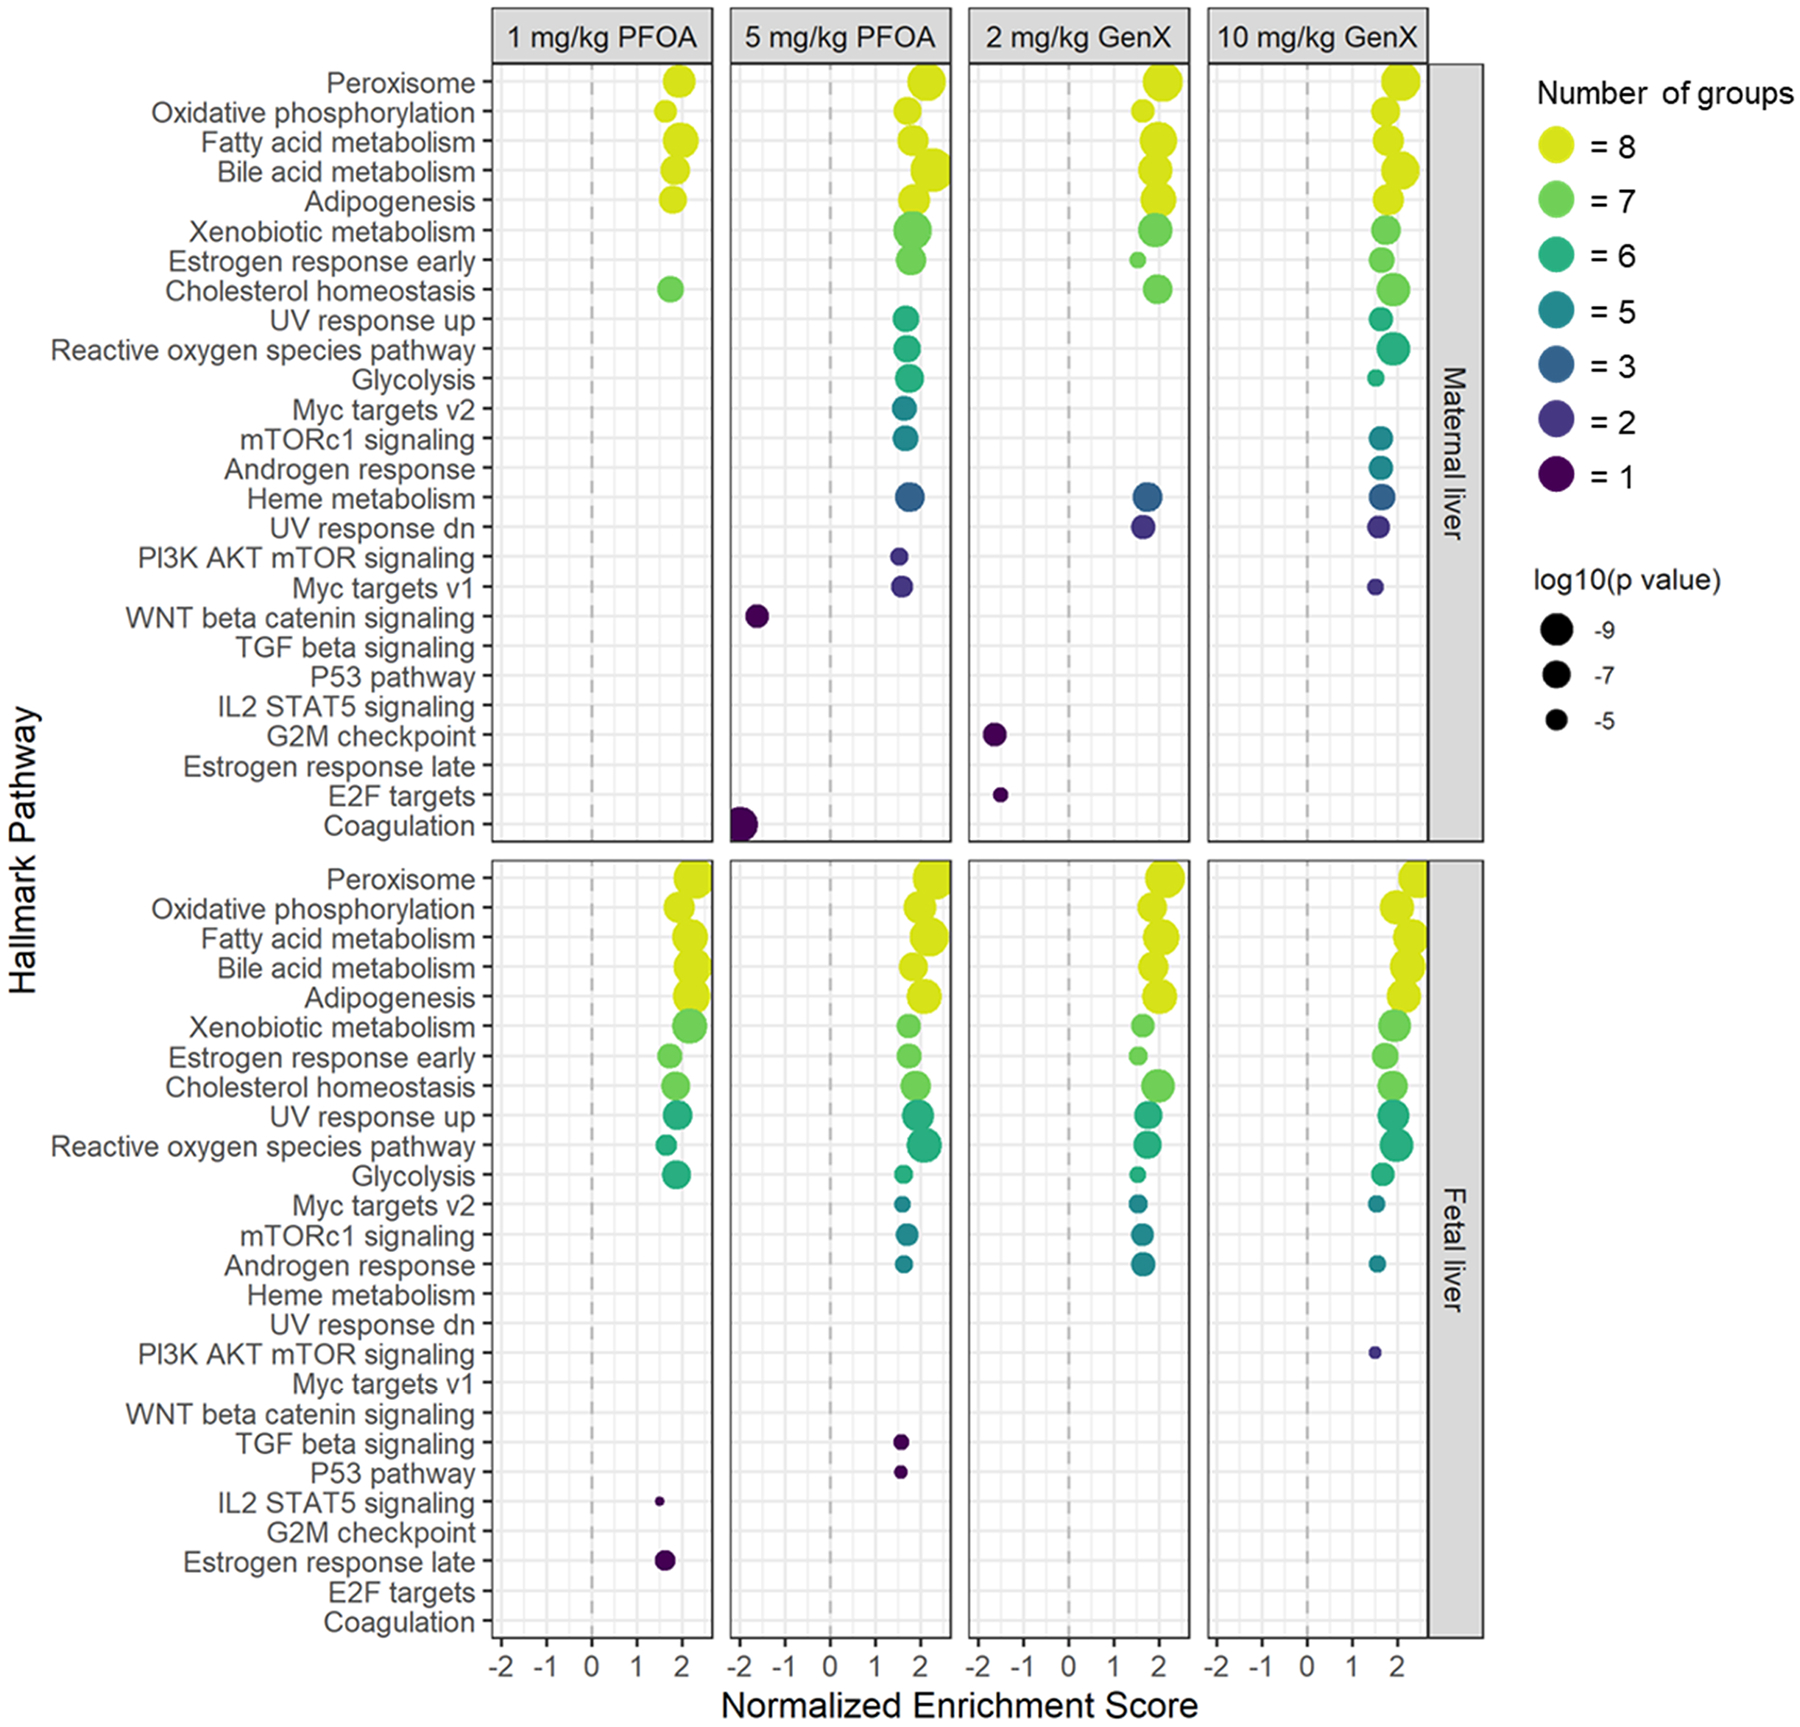
Figure 4. Normalized enrichment scores (NES) for significantly enriched MSigDB Hallmark Pathways in maternal (top panels) and fetal liver (bottom panels).
Size of the dot indicates the log10(p value) with larger dots corresponding to more significant p values. Dot color gradient corresponds to the number of groups (1–8, with lighter colors corresponding to higher values) for which the pathway was significantly enriched and blank regions on the plot indicate no statistical significance of the pathway NES for that specific group. P ≤ 0.05 for all pathways shown.
- Blake et al. 2022 Ecotox Figure 4 (1 MB)
- Copy of dep calls all conditions nes1.5 pvalue0.05 v3 (29 KB)
- hallmark pathway dot plot liver TGMX (2 KB)
- Significant NES hallmark pathway maternal fetal liver (10 KB)
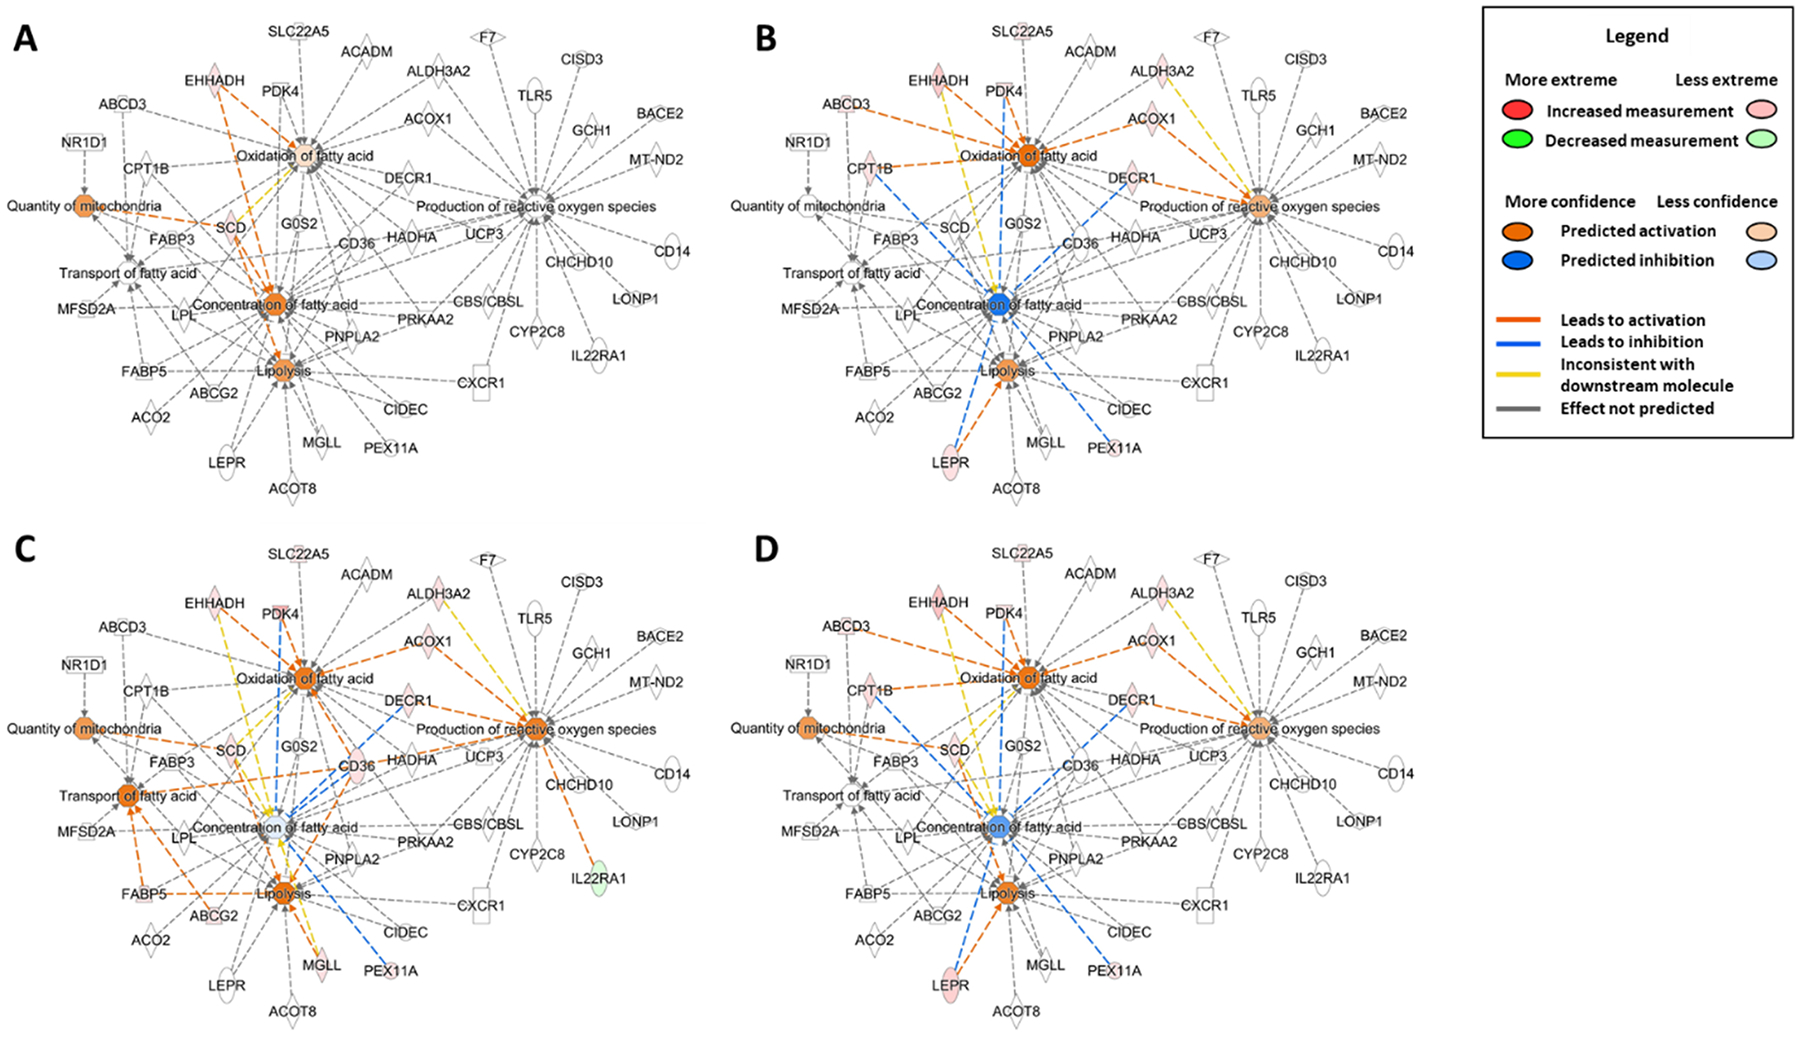
Figure 5. Gene networks for the Oxidative Phosphorylation Hallmark Pathway and related Hallmark Pathways constructed in Ingenuity Pathway Analysis using statistically significant
DEGs in (A) maternal liver after gestational exposure to 1 mg/kg PFOA, (B) fetal liver after in utero exposure to 1 mg/kg PFOA, (C) maternal liver after gestational exposure to 2 mg/kg GenX, and (D) fetal liver after in utero exposure to 2 mg/kg GenX. DEGs were considered significant if absolute fold-change values were ≥ 2 and p ≤ 0.005.
NCBI GEO Accession number GSE199233
- Blake et al. 2022 Ecotox Figure 5 (723 KB)
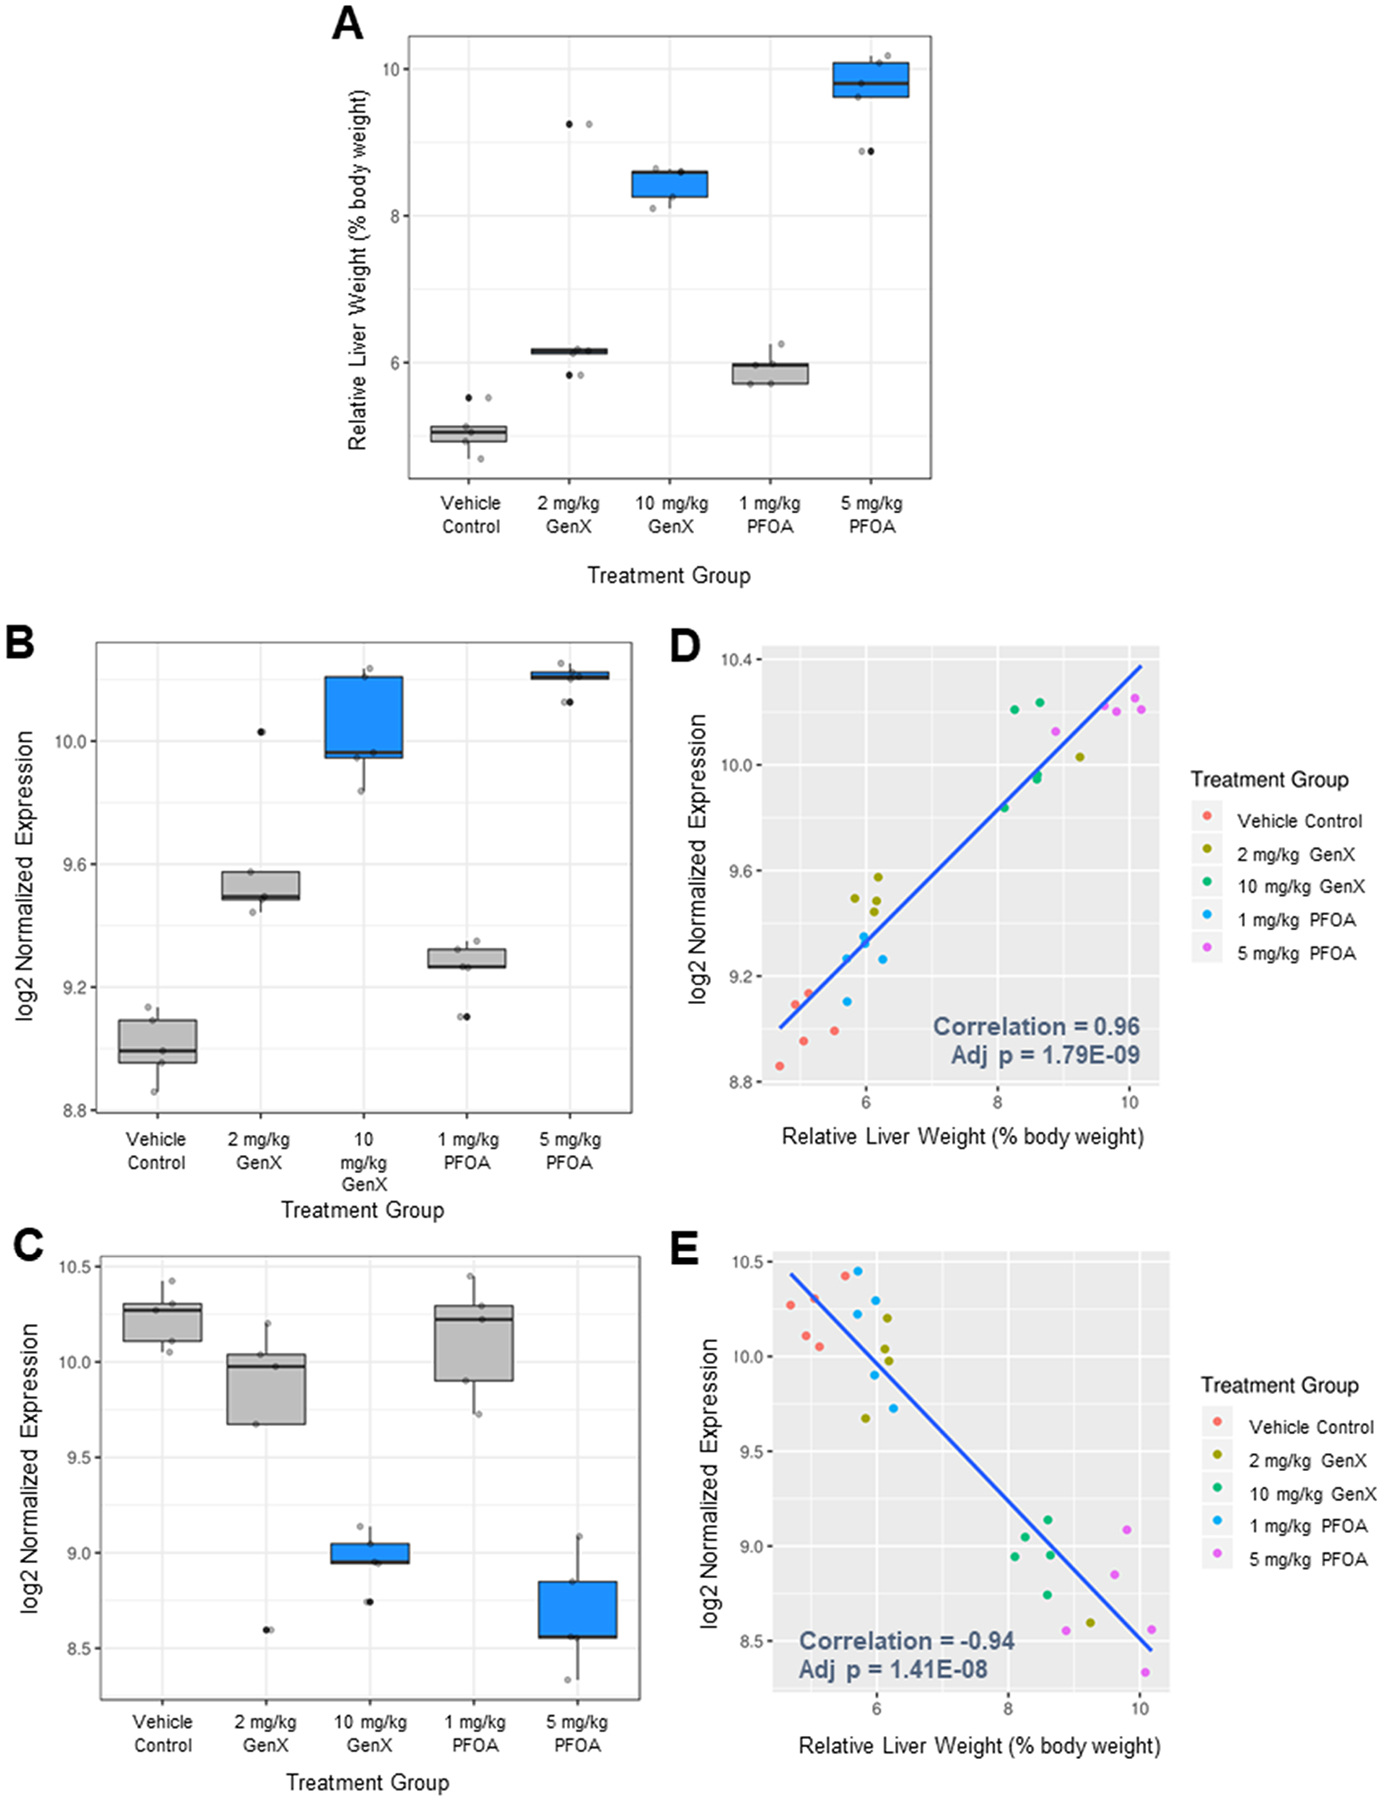
Figure 6. Correlation between individual dam gene expression and phenotype for two example genes, Aco2 and F11, and relative liver weight.
Box and whiskers plot showing dam relative liver weights (A) and normalized expression of (B) Aco2 and (C) F11 in the liver, with treatment groups significantly different from the Vehicle Control in solid blue. Transcriptome-phenotype correlation plots, r-squared values, and adjusted p-values for dam relative liver weight and (D) Aco2 and (E) F11 expression. N = 5 dams per treatment group.
- Blake et al. 2022 Ecotox Figure 6 (418 KB)
- Combined necropsy data E11.5 and E17.5 updated (16 KB)
- R format CBC and clin path data pregnant dams only (8 KB)
- Supplemental Table 6 (3 MB)
Supplemental Tables
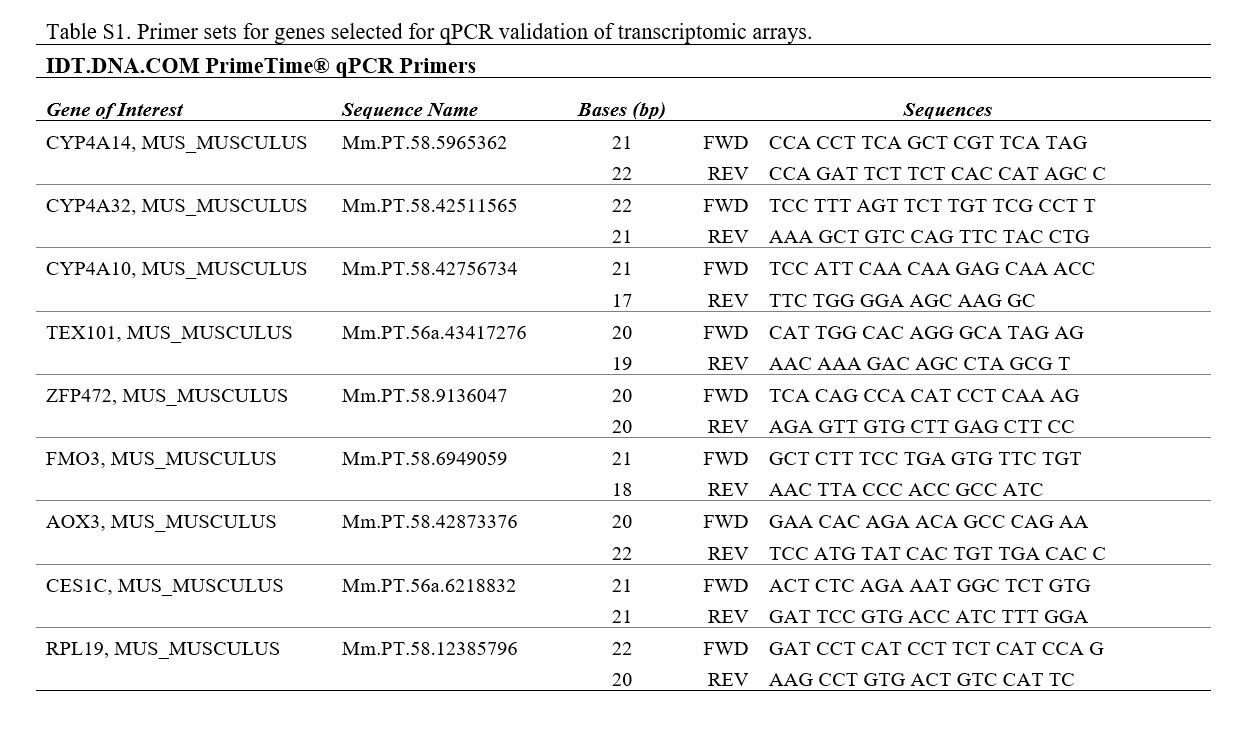
Table S1. Primer sets for genes selected for qPCR validation of transcriptomic arrays.
Table S2. Fold-change in 24 non-coding genes with significant differential expression in at least one group
NCBI GEO Accession number GSE199233
- Blake et al. 2022 Ecotox Supp Table S2 (137 KB)
- deg fold all conditions fold=2 pvalue=0.005 v4 (8 MB)
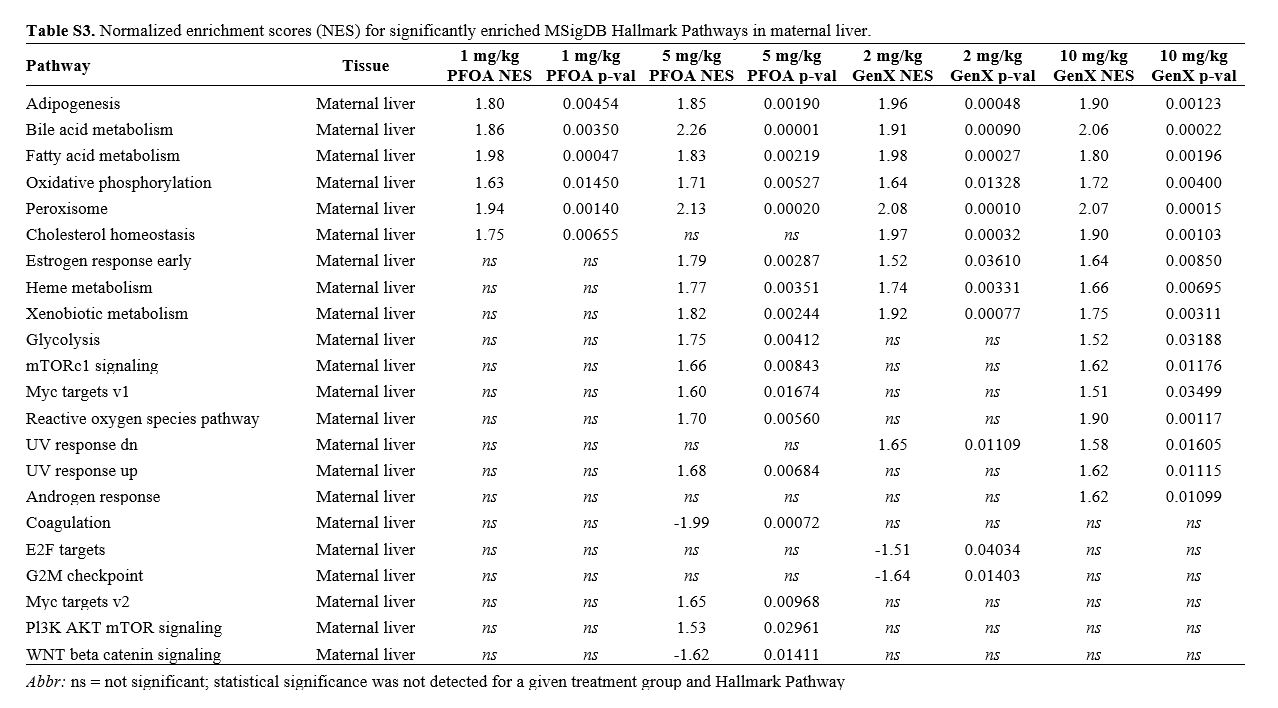
Table S3. Normalized enrichment scores (NES) for significantly enriched MSigDB Hallmark Pathways in maternal liver.
- Blake et al. 2022 Ecotox Supp Table S3 (167 KB)
- Copy of dep calls all conditions nes1.5 pvalue0.05 v3 (29 KB)
Table S4. Normalized enrichment scores (NES) for significantly enriched MSigDB Hallmark Pathways in fetal liver.
- Blake et al. 2022 Ecotox Supp Table S4 (153 KB)
- Copy of dep calls all conditions nes1.5 pvalue0.05 v3 (29 KB)
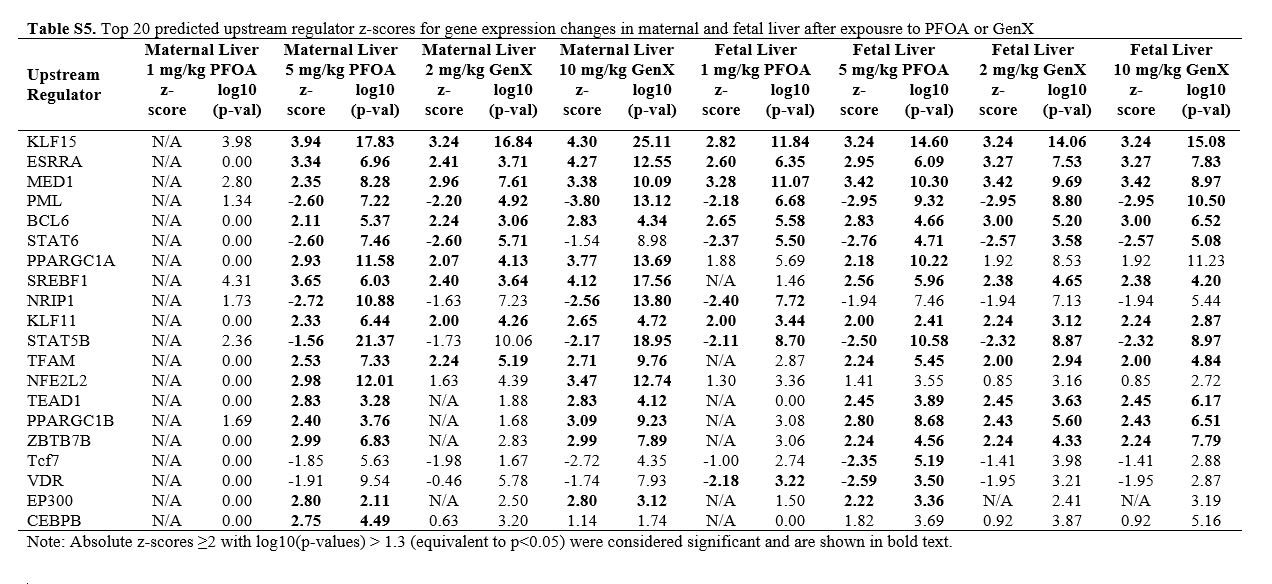
Table S5. Top 20 predicted upstream regulator z-scores for gene expression changes in maternal and fetal liver after exposure to PFOA or GenX
NCBI GEO Accession number GSE199233
Table S6. Correlations between gene expression changes and phenotype in maternal liver
- Supplemental Table 6 (3 MB)
Supplemental Figures
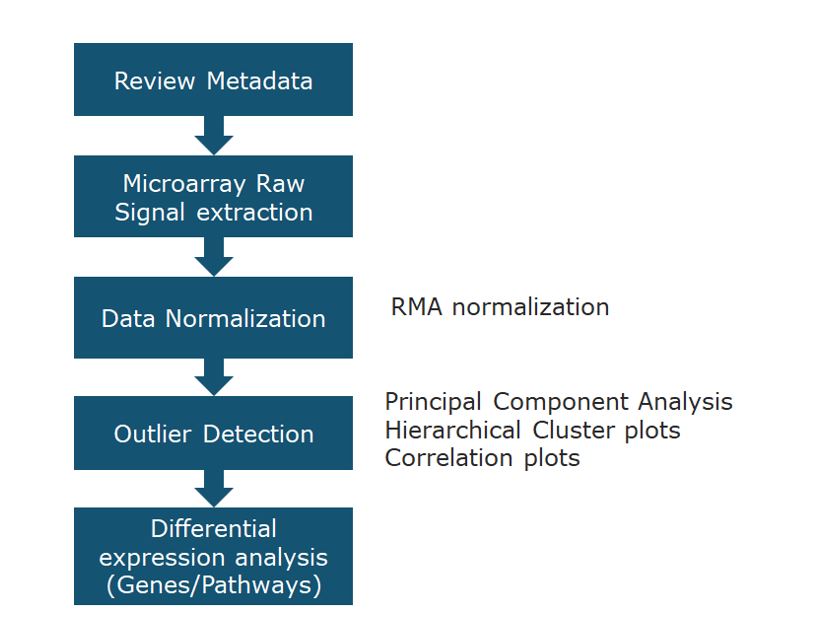
Figure S1. Microarray data analysis workflow. RMA = Robust Multi-array Average. Raw data are accessible on NCBI GEO (accession number GSE199233).
Figure S2. Principal components analysis.
No outliers were detected.
NCBI GEO Accession number GSE199233
Figure S3. Heatmap of 407 DEGs in maternal liver that were significantly altered in the 5 mg/kg PFOA, 2 mg/kg GenX, and 10 mg/kg GenX exposure groups where each column represents an individual
animal to highlight biological variability within a given treatment group NCBI GEO Accession number GSE199233
- Blake et al. 2022 Ecotox Supp Figure S3 (84 KB)
- deg fold all conditions fold=2 pvalue=0.005 v4 (8 MB)
Figure S4. Heatmap of 202 DEGs in fetal liver that were significantly altered in at least one of the exposure groups where each column represents an individual animal to highlight biological
variability within a given treatment group
NCBI GEO Accession number GSE199233
- Blake et al. 2022 Ecotox Supp Figure S4 (82 KB)
- deg fold all conditions fold=2 pvalue=0.005 v4 (8 MB)
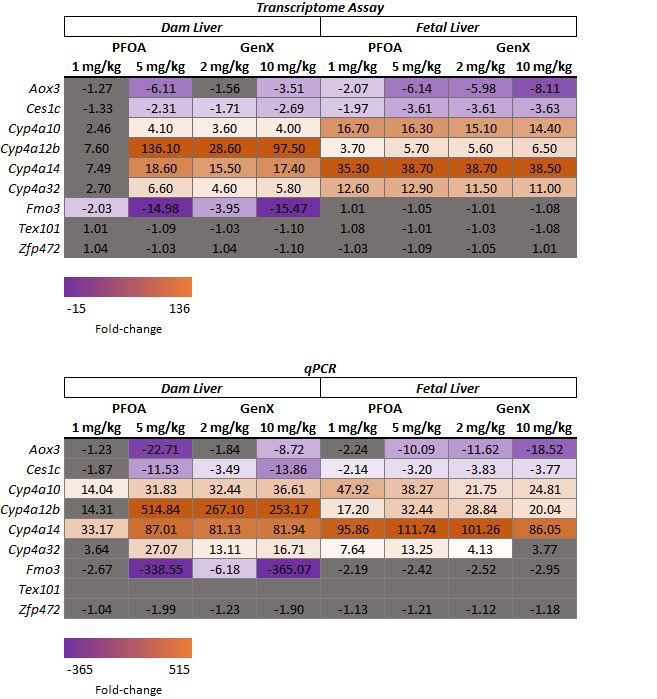
Figure S5. Heatmap of transcriptomic gene expression results and corresponding qPCR validation results for select genes.
Scale bars indicating the magnitude and direction of gene expression fold change are shown below each heatmap with gray cells corresponding to non-significant genes or genes with non-detectable levels of expression. For the transcriptomic analysis (top), the statistical cutoff applied to each gene was: p-value<0.005 and an absolute fold-change ≥2. For the qPCR analysis (bottom), the statistical cutoff applied to each gene was: p-value<0.05 and an absolute fold-change ≥2.
- Blake et al. 2022 Ecotox Supp Figure S5 (97 KB)
- Liver E17.5 qPCR Validation TGMX Stats (293 KB)
- TGMX Liver Validation Results HKGrpl19 (394 KB)
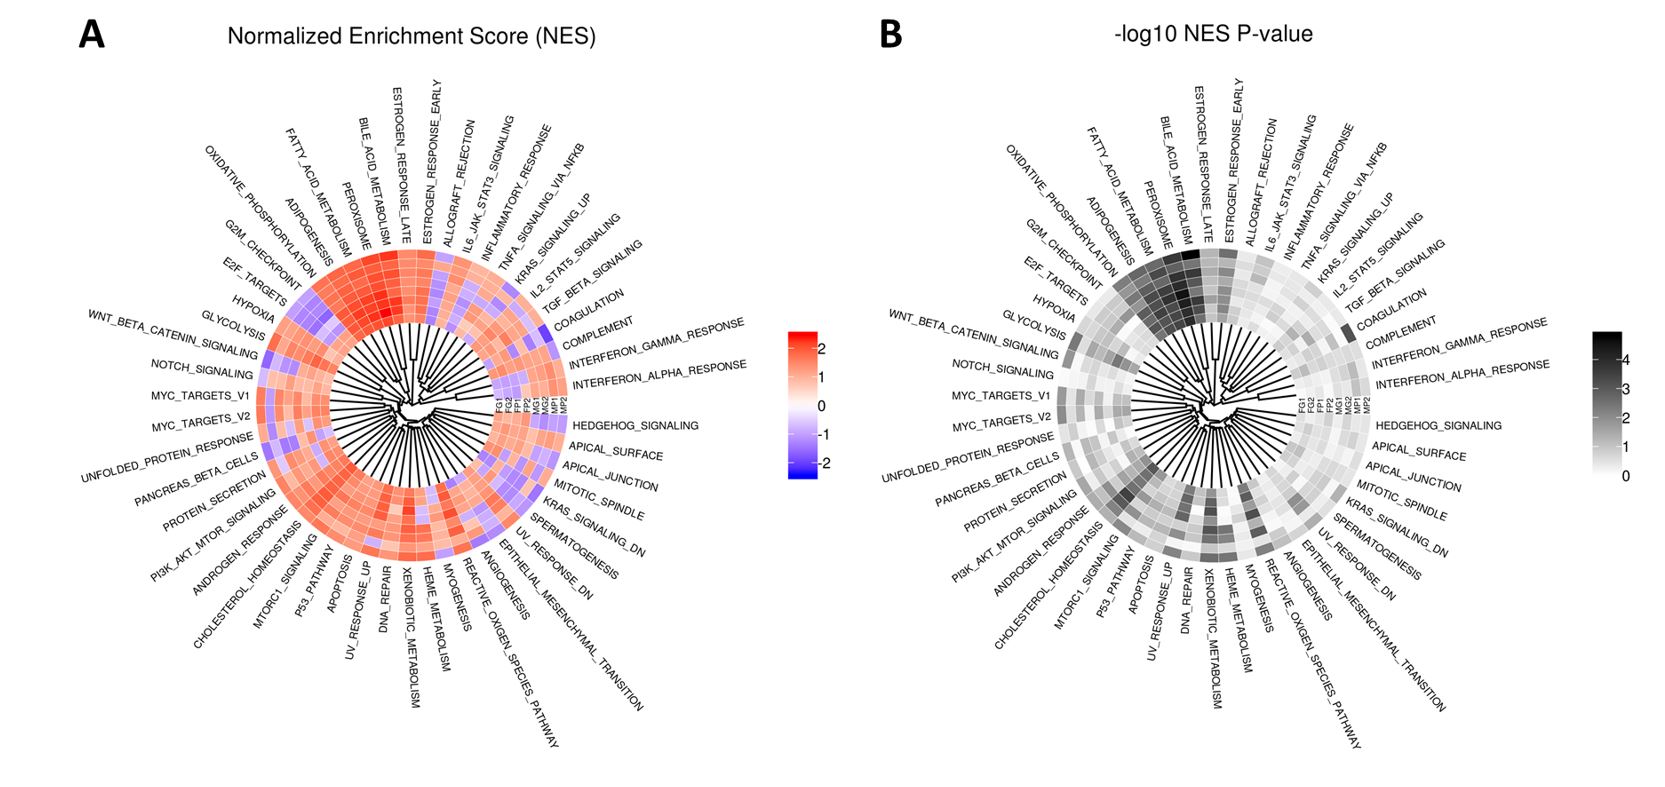
Figure S6. GSEA Hallmark Pathway analysis of all hallmark pathways for maternal and fetal liver gene expression changes.
(A) Normalized enrichment score, (B) p-values on the –log10 scale. Abbr: FG1 = Fetal liver 2 mg/kg GenX, FG2 = Fetal liver 10 mg/kg GenX, FP1 = Fetal liver 1 mg/kg PFOA, FP2 = Fetal liver 5 mg/kg PFOA, MG1 = Maternal liver 2 mg/kg GenX, MG2 = Maternal liver 10 mg/kg GenX, MP1 = Maternal liver 1 mg/kg PFOA, MP2 = Maternal liver 5 mg/kg PFOA.
NCBI GEO Accession number GSE199233
- Blake et al. 2022 Ecotox Supp Figure S6 (182 KB)
- Copy of dep calls all conditions nes1.5 pvalue0.05 v3 (29 KB)
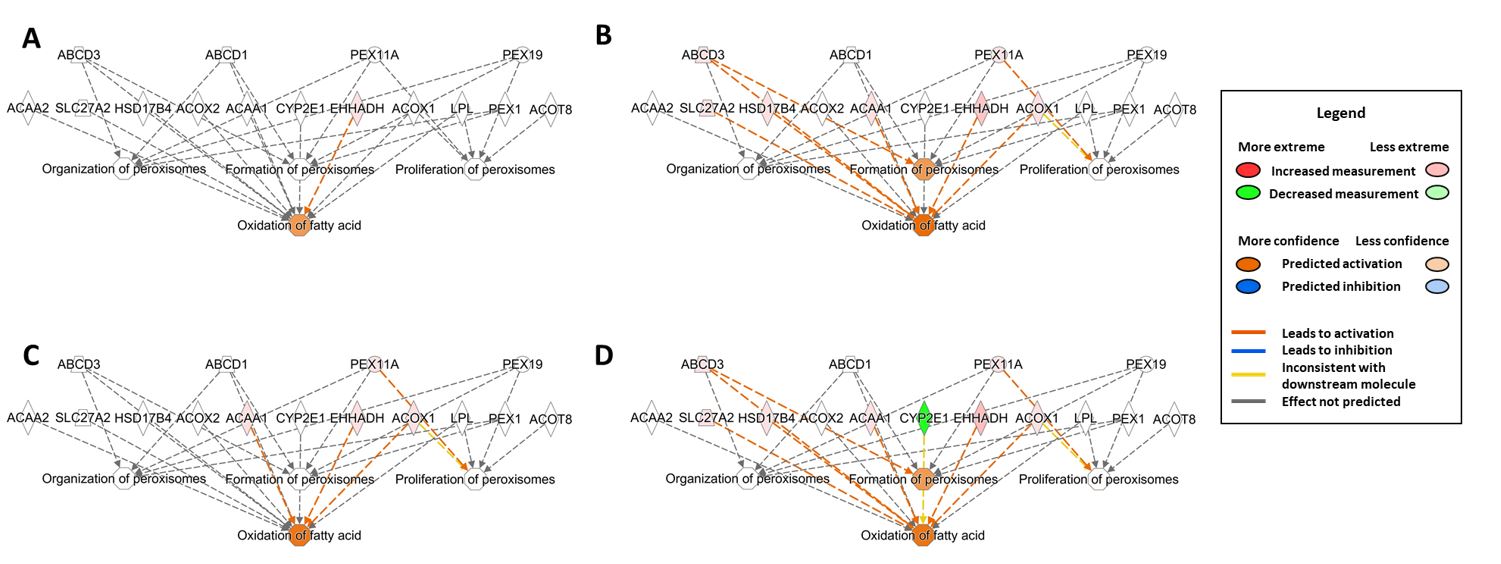
Figure S7. Gene networks for the Peroxisome Hallmark Pathway and related Hallmark Pathways constructed in Ingenuity Pathway Analysis using statistically significant DEGs
in (A) maternal liver after gestational exposure to 1 mg/kg PFOA, (B) fetal liver after in utero exposure to 1 mg/kg PFOA, (C) maternal liver after gestational exposure to 2 mg/kg GenX, and (D) fetal liver after in utero exposure to 2 mg/kg GenX. DEGs were considered significant if absolute fold-change values were ≥ 2 and p ≤ 0.005.
NCBI GEO Accession number GSE199233
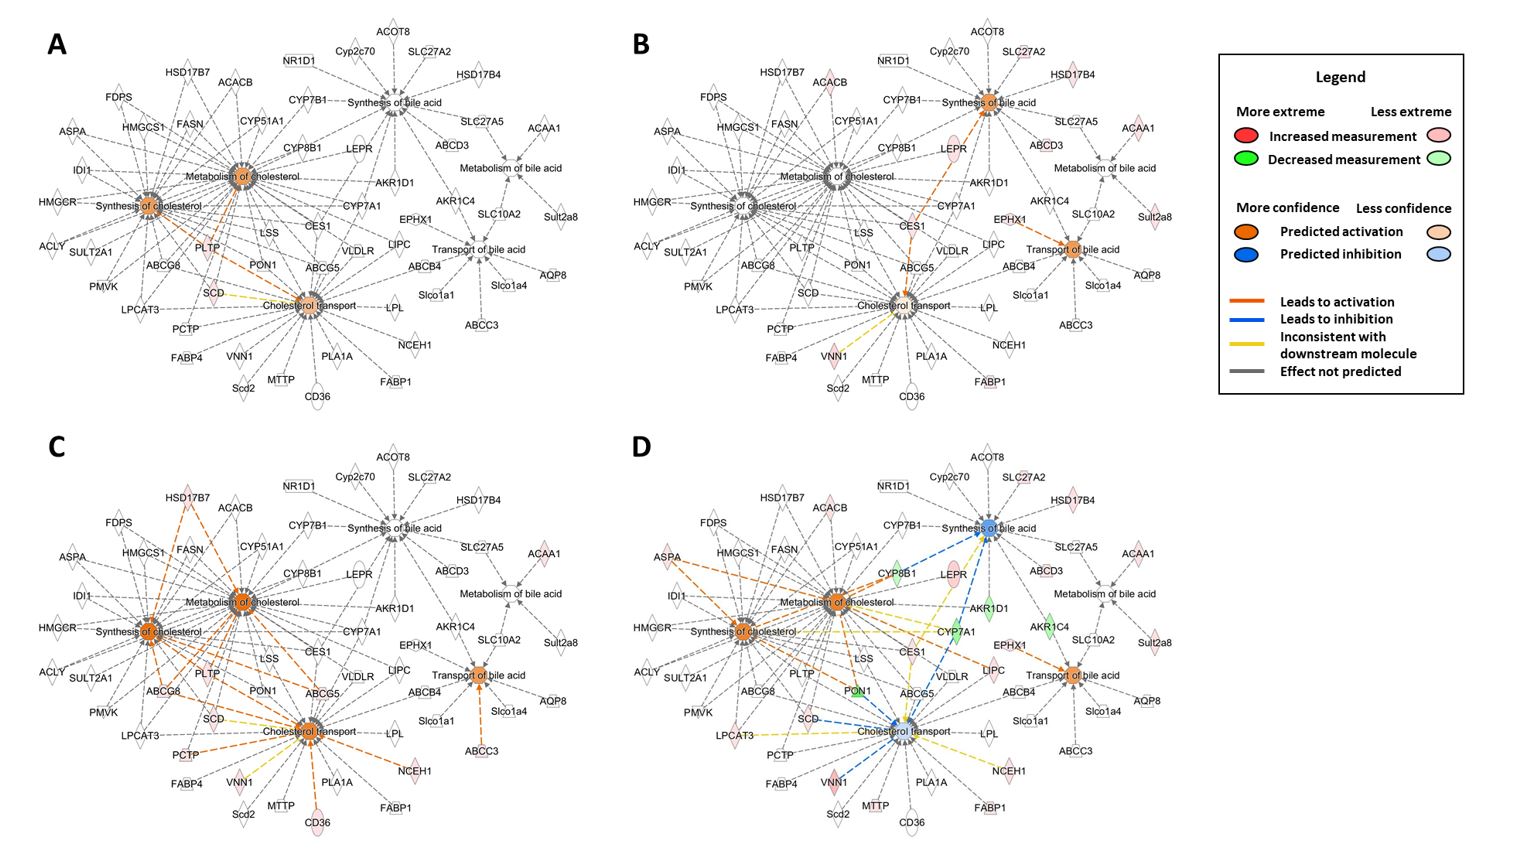
Figure S8. Gene networks for the Cholesterol Homeostasis Hallmark Pathway, Bile Acid Hallmark Pathway and related Hallmark Pathways constructed in Ingenuity Pathway Analysis using statistically
significant DEGs in (A) maternal liver after gestational exposure to 1 mg/kg PFOA, (B) fetal liver after in utero exposure to 1 mg/kg PFOA, (C) maternal liver after gestational exposure to 2 mg/kg GenX, and (D) fetal liver after in utero exposure to 2 mg/kg GenX. DEGs were considered significant if absolute fold-change values were ≥ 2 and p ≤ 0.005.
NCBI GEO Accession number GSE199233
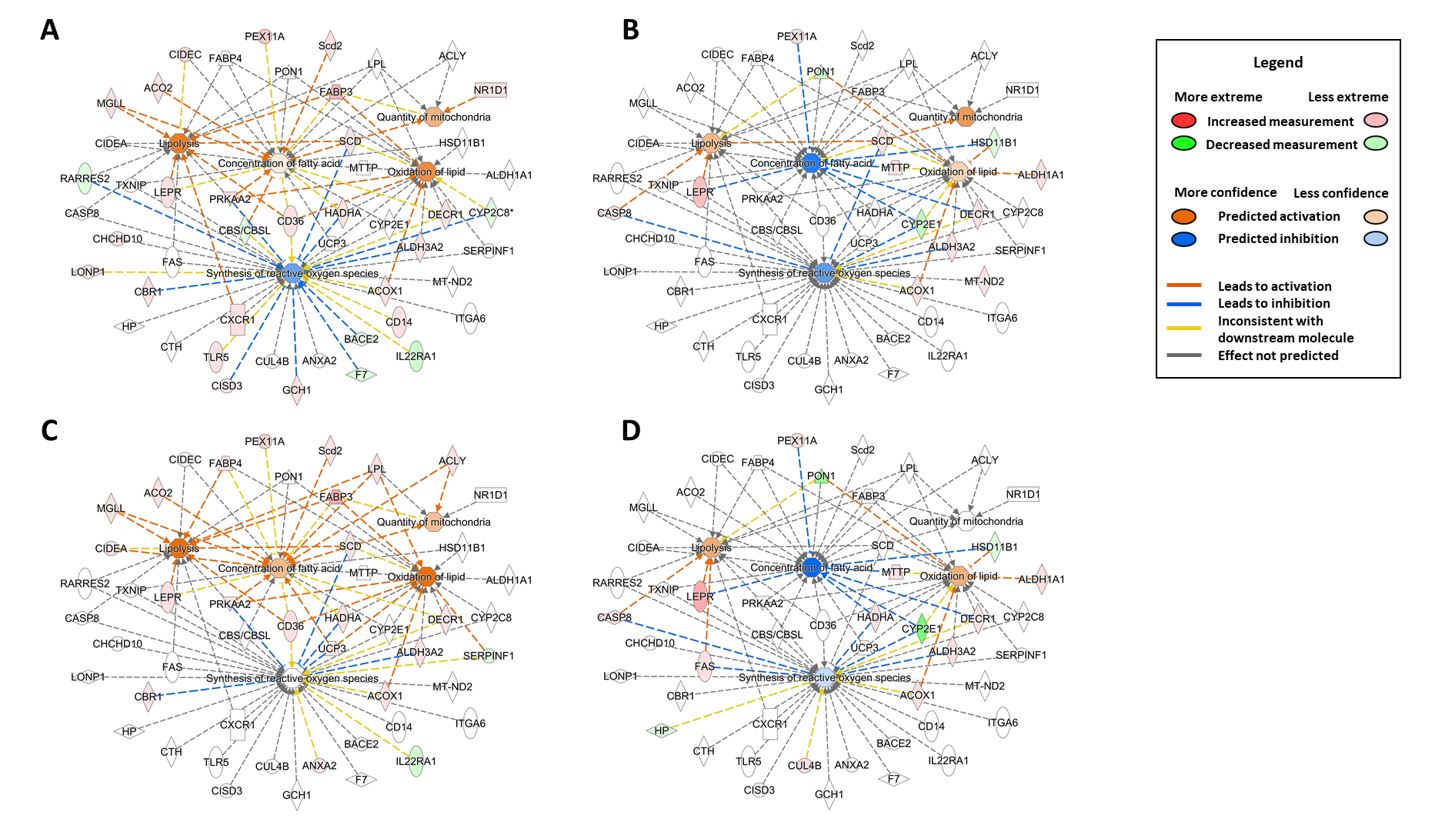
Figure S9. Gene networks for the Oxidative Phosphorylation Hallmark Pathway and related Hallmark Pathways constructed in Ingenuity Pathway Analysis using statistically significant DEGs
in (A) maternal liver after gestational exposure to 5 mg/kg PFOA, (B) fetal liver after in utero exposure to 5 mg/kg PFOA, (C) maternal liver after gestational exposure to 10 mg/kg GenX, and (D) fetal liver after in utero exposure to 10 mg/kg GenX. DEGs were considered significant if absolute fold-change values were ≥ 2 and p ≤ 0.005.
NCBI GEO Accession number GSE199233
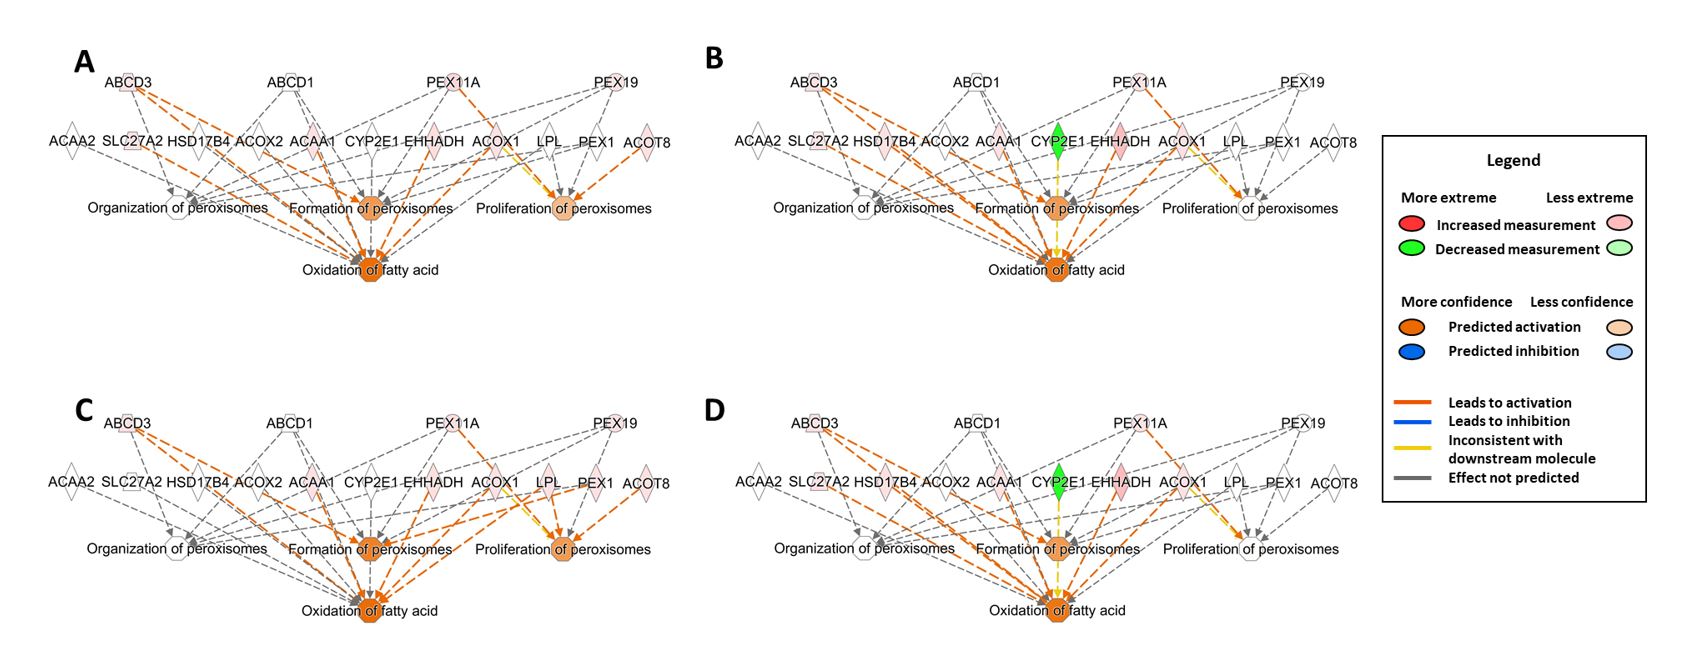
Figure S10. Gene networks for the Peroxisome Hallmark Pathway and related Hallmark Pathways constructed in Ingenuity Pathway Analysis using statistically significant DEGs
in (A) maternal liver after gestational exposure to 5 mg/kg PFOA, (B) fetal liver after in utero exposure to 5 mg/kg PFOA, (C) maternal liver after gestational exposure to 10 mg/kg GenX, and (D) fetal liver after in utero exposure to 10 mg/kg GenX. DEGs were considered significant if absolute fold-change values were ≥ 2 and p ≤ 0.005.
NCBI GEO Accession number GSE199233
Figure S11. Gene networks for the Cholesterol Homeostasis Hallmark Pathway, Bile Acid Hallmark Pathway and related Hallmark Pathways constructed in Ingenuity Pathway Analysis using statistically
significant DEGs in (A) maternal liver after gestational exposure to 5 mg/kg PFOA, (B) fetal liver after in utero exposure to 5 mg/kg PFOA, (C) maternal liver after gestational exposure to 10 mg/kg GenX, and (D) fetal liver after in utero exposure to 10 mg/kg GenX. DEGs were considered significant if absolute fold-change values were ≥ 2 and p ≤ 0.005.
NCBI GEO Accession number GSE199233