

Development and Validation of a Computational Model for Androgen Receptor Activity
Kleinstreuer NC, Ceger P, Watt ED, Martin M, Houck K, Browne P, Thomas RS, Casey WM, Dix DJ, Allen D, Sakamuru S, Xia M, Huang R, Judson R.
Chemical Research in Toxicology (2017)
DOI: https://doi.org/10.1021/acs.chemrestox.6b00347
PMID: 27933809
Publication
Abstract
Testing thousands of chemicals to identify potential androgen receptor (AR) agonists or antagonists would cost millions of dollars and take decades to complete using current validated methods. High-throughput in vitro screening (HTS) and computational toxicology approaches can more rapidly and inexpensively identify potential androgen-active chemicals. We integrated 11 HTS ToxCast/Tox21 in vitro assays into a computational network model to distinguish true AR pathway activity from technology-specific assay interference. The in vitro HTS assays probed perturbations of the AR pathway at multiple points (receptor binding, coregulator recruitment, gene transcription, and protein production) and multiple cell types. Confirmatory in vitro antagonist assay data and cytotoxicity information were used as additional flags for potential nonspecific activity. Validating such alternative testing strategies requires high-quality reference data. We compiled 158 putative androgen-active and -inactive chemicals from a combination of international test method validation efforts and semiautomated systematic literature reviews. Detailed in vitro assay information and results were compiled into a single database using a standardized ontology. Reference chemical concentrations that activated or inhibited AR pathway activity were identified to establish a range of potencies with reproducible reference chemical results. Comparison with existing Tier 1 AR binding data from the U.S. EPA Endocrine Disruptor Screening Program revealed that the model identified binders at relevant test concentrations (<100 μM) and was more sensitive to antagonist activity. The AR pathway model based on the ToxCast/Tox21 assays had balanced accuracies of 95.2% for agonist (n = 29) and 97.5% for antagonist (n = 28) reference chemicals. Out of 1855 chemicals screened in the AR pathway model, 220 chemicals demonstrated AR agonist or antagonist activity and an additional 174 chemicals were predicted to have potential weak AR pathway activity.
Figures
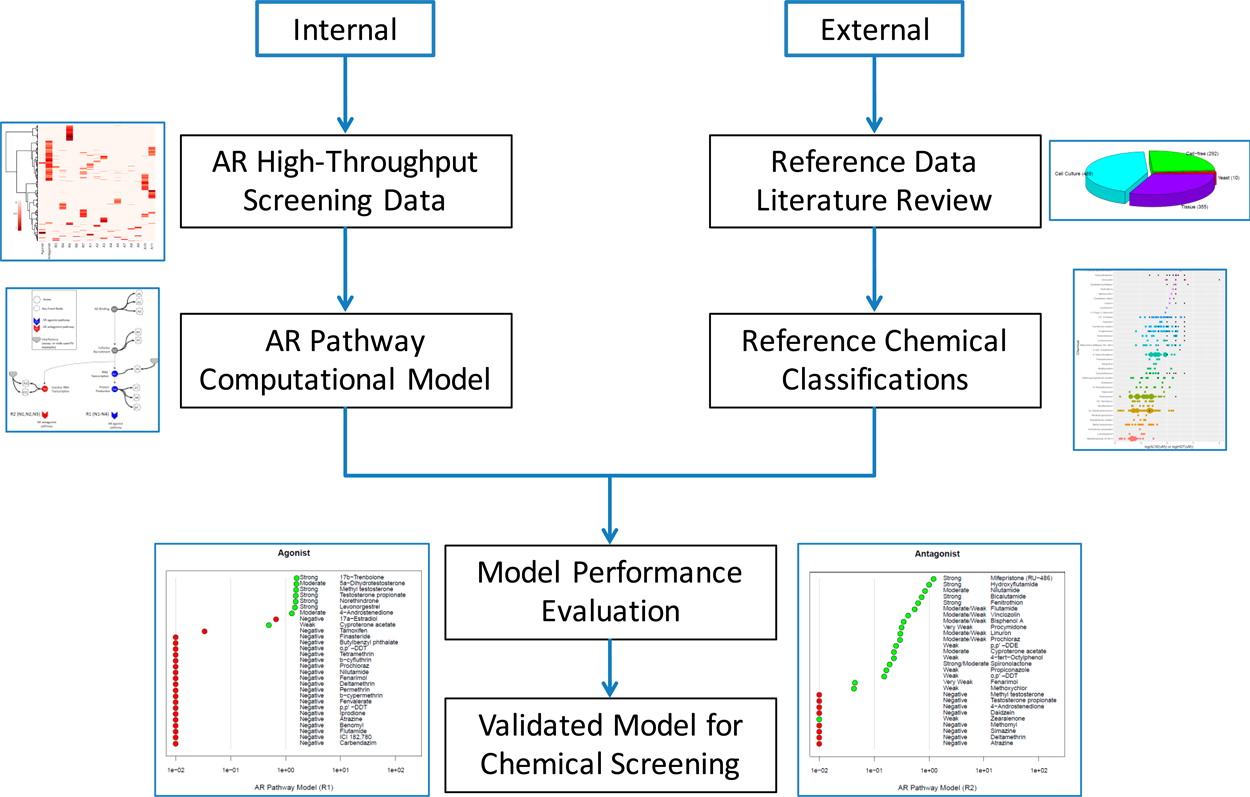
Figure 1. Graphical representation of the AR pathway model workflow
The internal process consisted of generating HTS data on 11 AR assays and building a computational model of AR pathway agonist/antagonist activity. The external process involved systematic literature review for reference data and curation of the reference chemical list based on published data. The model performance was evaluated against the reference chemicals, and screening results from the validated model on a large set of environmental chemicals are presented. AR = androgen receptor, HTS = high-throughput screening data.
- Figure 1 (199 KB)
Figure 2. Graphical representation of the AR pathway model based on Tox21/ToxCast assays
Graphical representation of the AR pathway model based on Tox21/ToxCast assays: Circular nodes (N1–N5) represent key biological events along the pathway, where dark gray coloring indicates key events common to agonism and antagonism, and blue and red coloring indicates key events specific to agonism or antagonism, respectively. White stars (A1–A11) represent the in vitro assays that measure activity at the biological nodes. Colored arrow heads (R1/R2) represent true AR agonism/antagonism, respectively, and are comprised of the nodes listed in the diagram and their associated assays. Light gray arrow heads demonstrate examples of technology-specific interference or biological interference pathways, where individual assays or specific groups of assays are positive due to non-AR-mediated activity. Each in vitro assay and each key event node has an assay- or biology-specific interference pathway (defined in Table 1). Interference pathways R3–R7 correspond to nodes N1–N5, respectively, and interference pathways A1–A11 correspond to the respective assays. Two examples of interference pathways, one that is assay-specific (A6) and one that is node-specific (R7), are shown as light gray arrow heads. AR = androgen receptor.
- Figure 2 (190 KB)
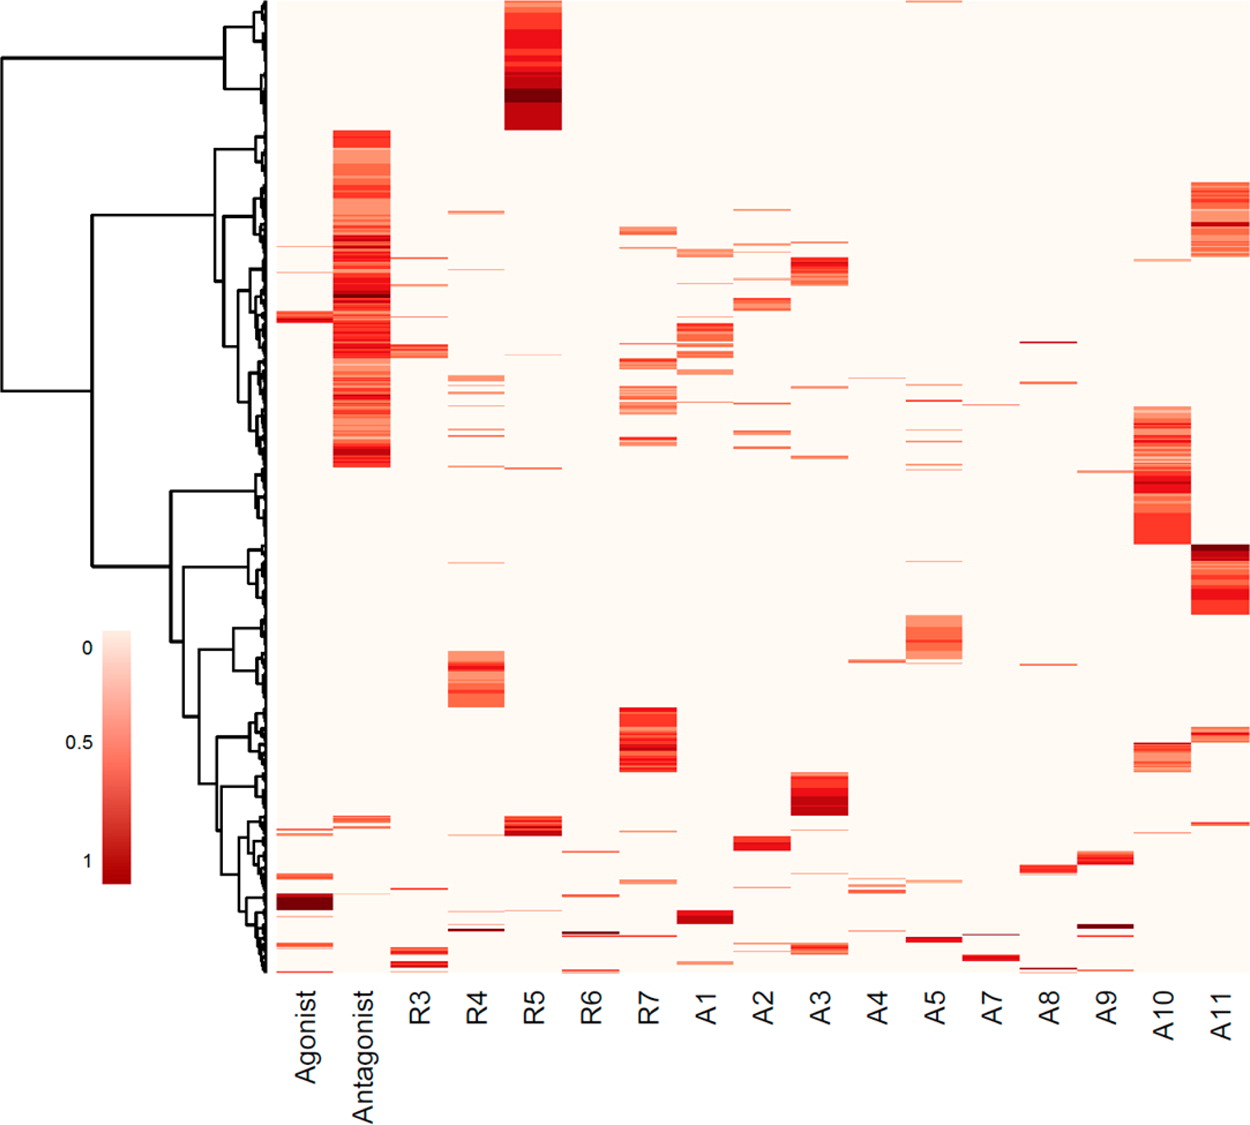
Figure 3. Distribution of model AUC values across 763 chemicals
Heatmap shows the distribution of model area under the curve (AUC) values for 763 chemicals that were active in at least one AR pathway assay. The first two columns represent predictions for agonist (R1) and antagonist (R2) activity, and the remaining columns represent predicted assay (A1–11)- or biology (R3–7)-specific interference corresponding to the pathway diagram in Figure 2 and the interference pathways shown in Table 1. The darker red indicates higher AUC values corresponding to more potent activity (scale: 0.001–1). Clustering was done using Ward’s method.
- Figure 3 (160 KB)
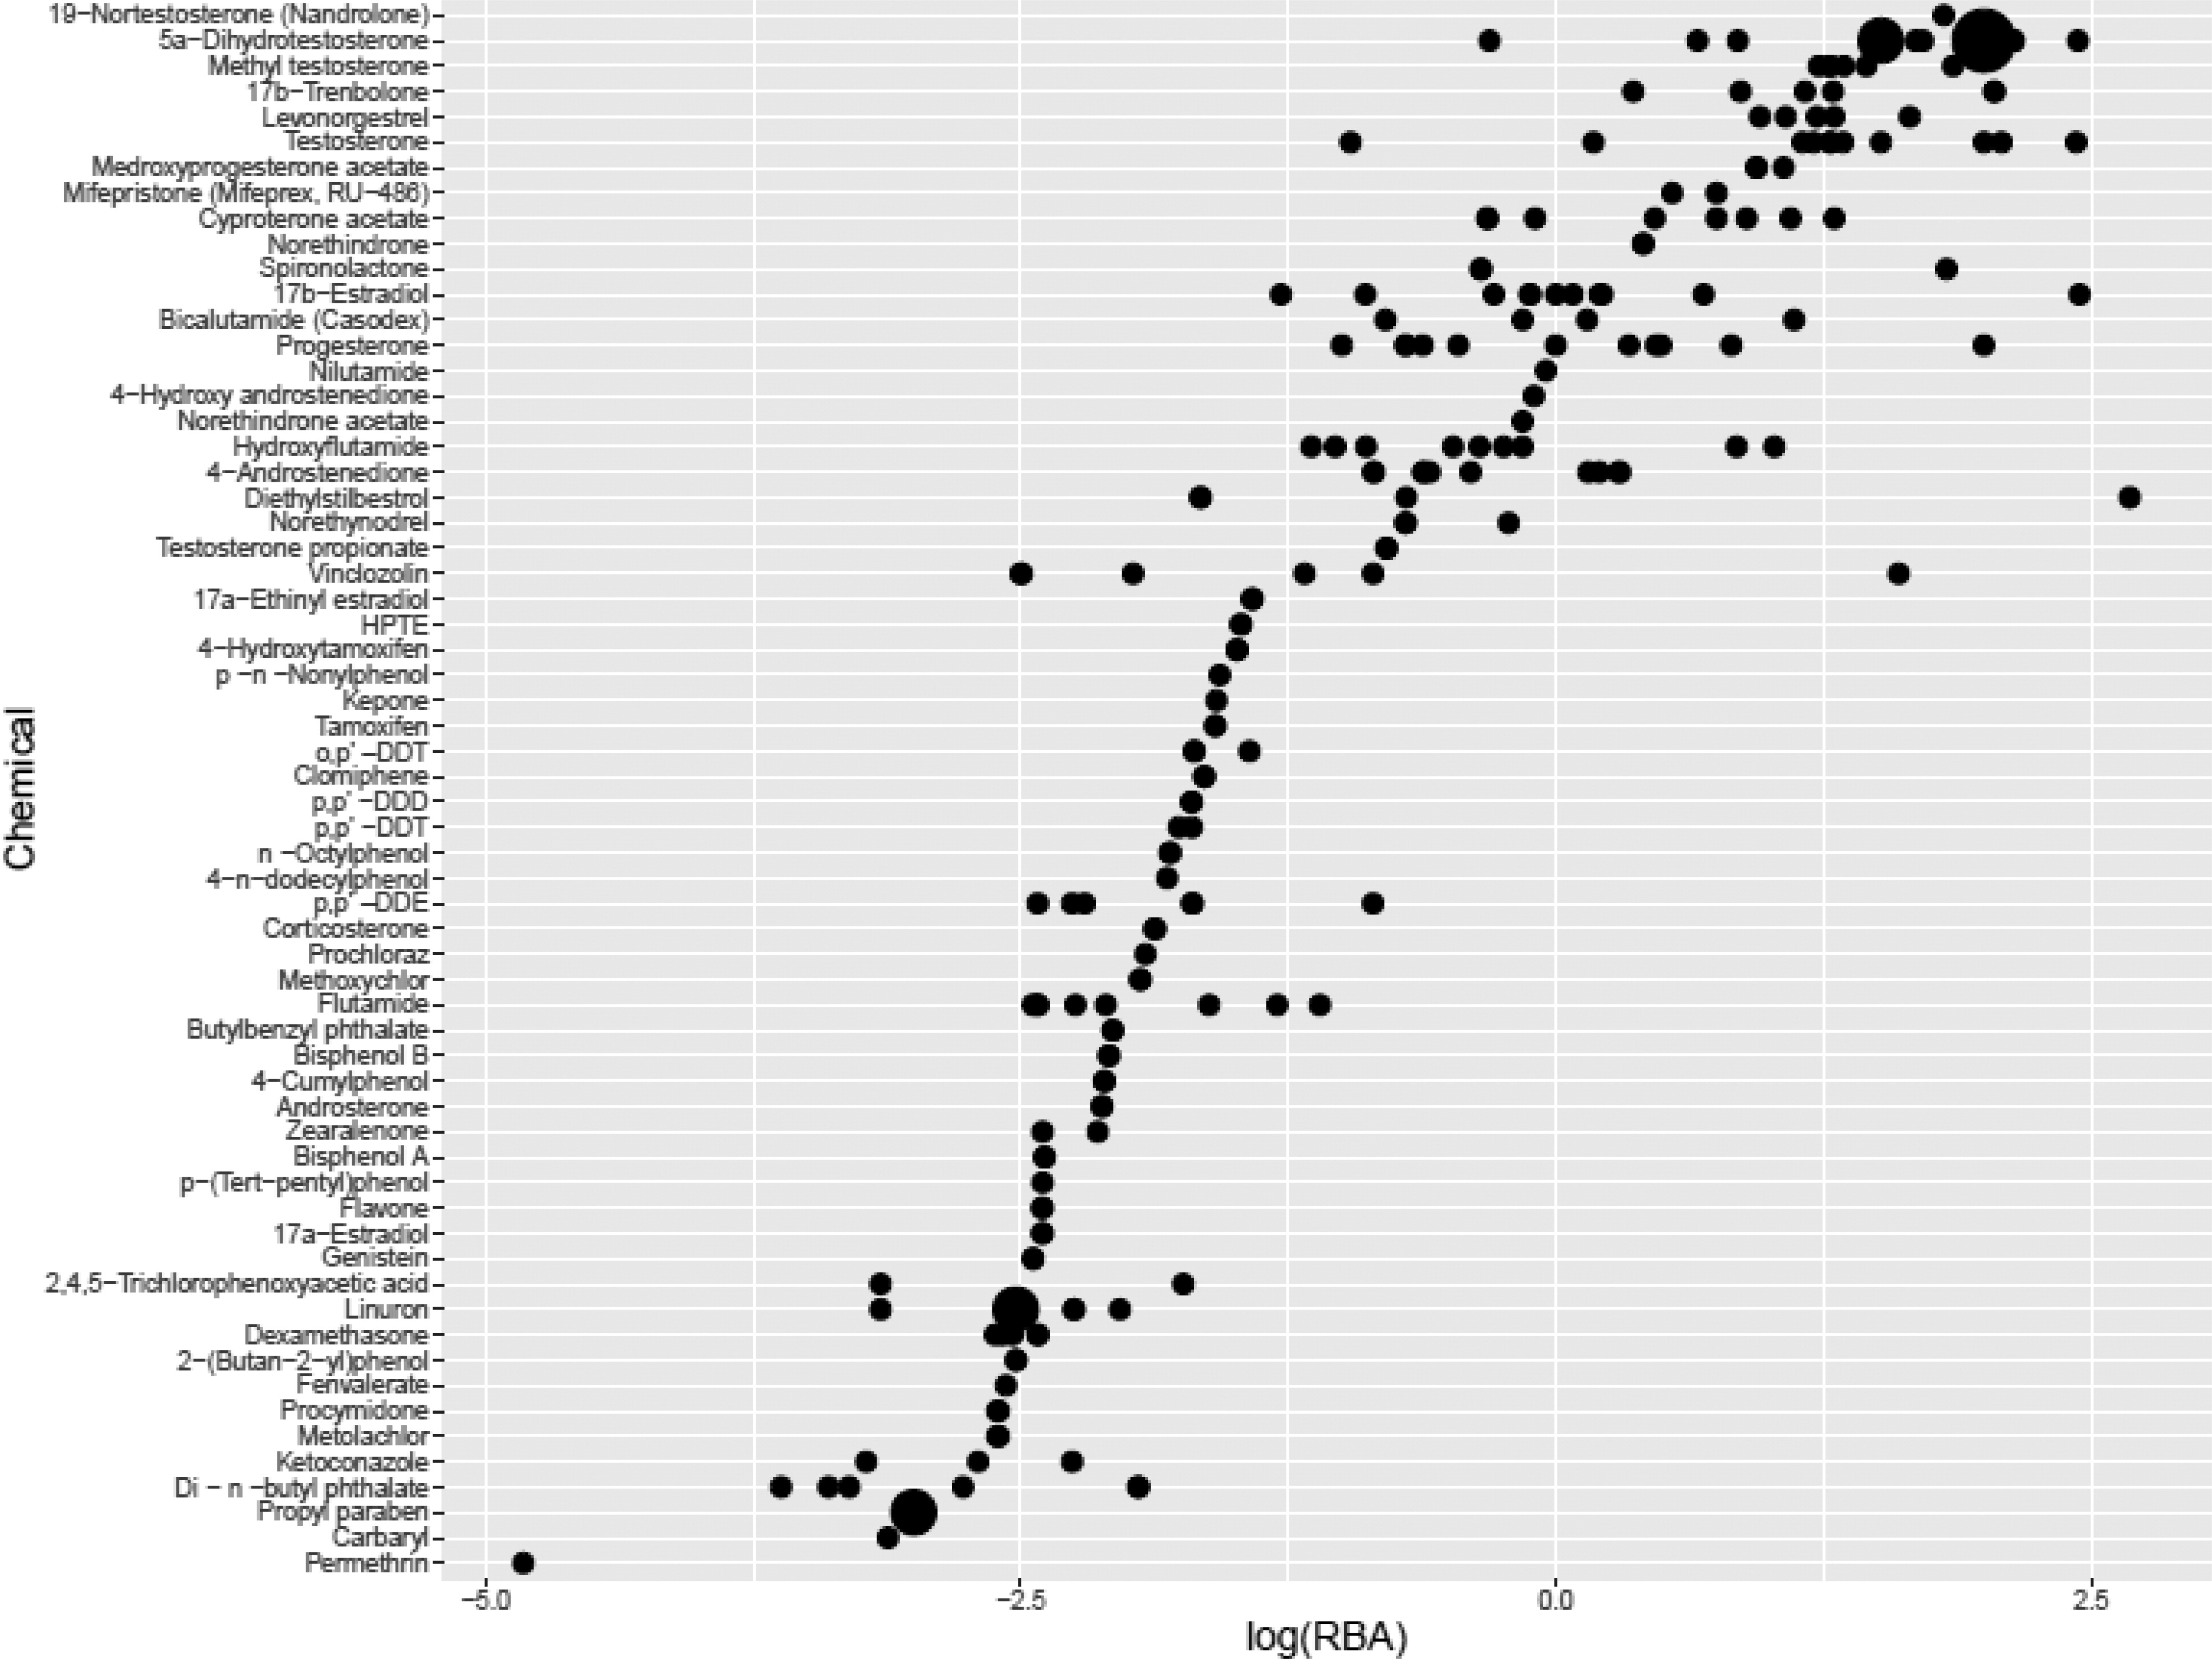
Figure 4. AR binding affinities relative to R1881 reference
Chemicals are listed along the x-axis; y-axis represents the log10 (RBA). The size of the dot increases with the number of observations (range: 1–15). Relative binding affinity decreases moving from top to bottom with a total of 61 chemicals described. AR = androgen receptor; R1881 = methyltrienolone; RBA = relative binding affinity.
- Figure 4 (1 MB)
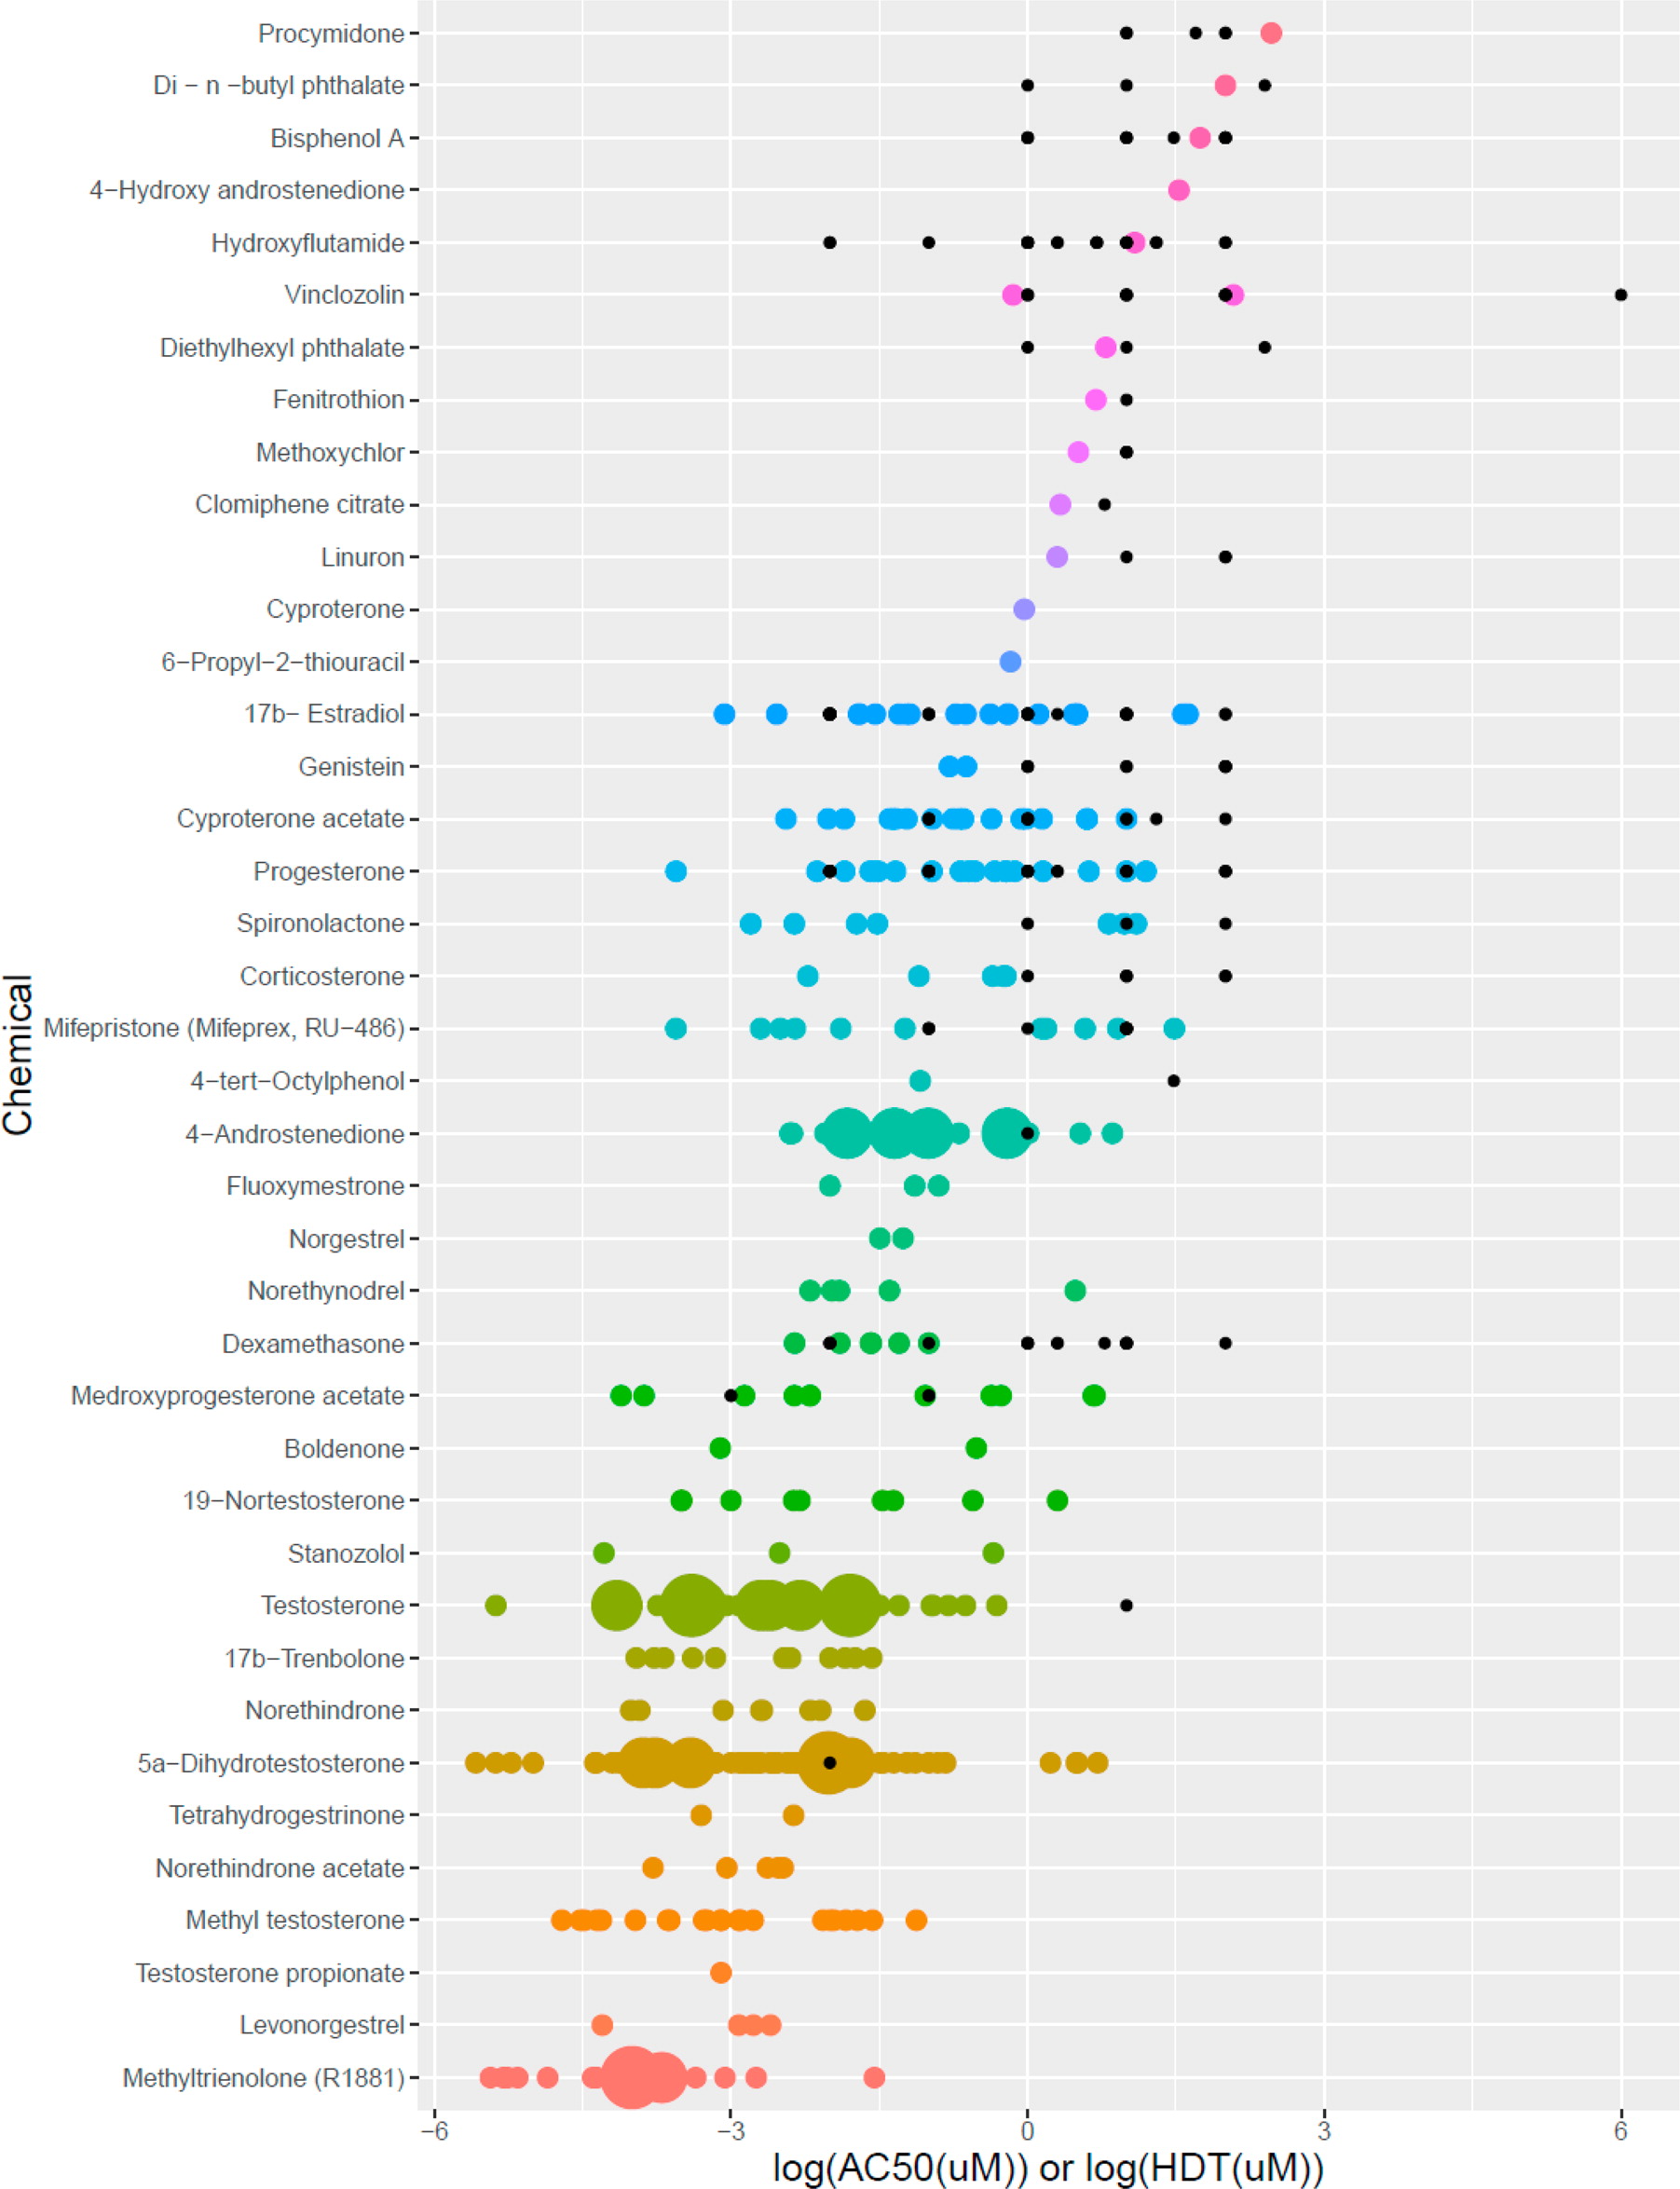
Figure 5. Comparing AR transactivation agonist results
Chemicals are listed along the x-axes, and the log transformed doses are listed along the y-axis. The colored dots represent positive results in log10 (AC50), and the black dots represent negative results in log10 (HDT). The size of the dot increases with the number of observations (range: 1–79). Agonist potency decreases moving from bottom to top, with a total of 40 chemicals described. AC50 = half-maximal activity concentration; AR = androgen receptor; HDT = highest dose tested.
- Figure 5 (497 KB)
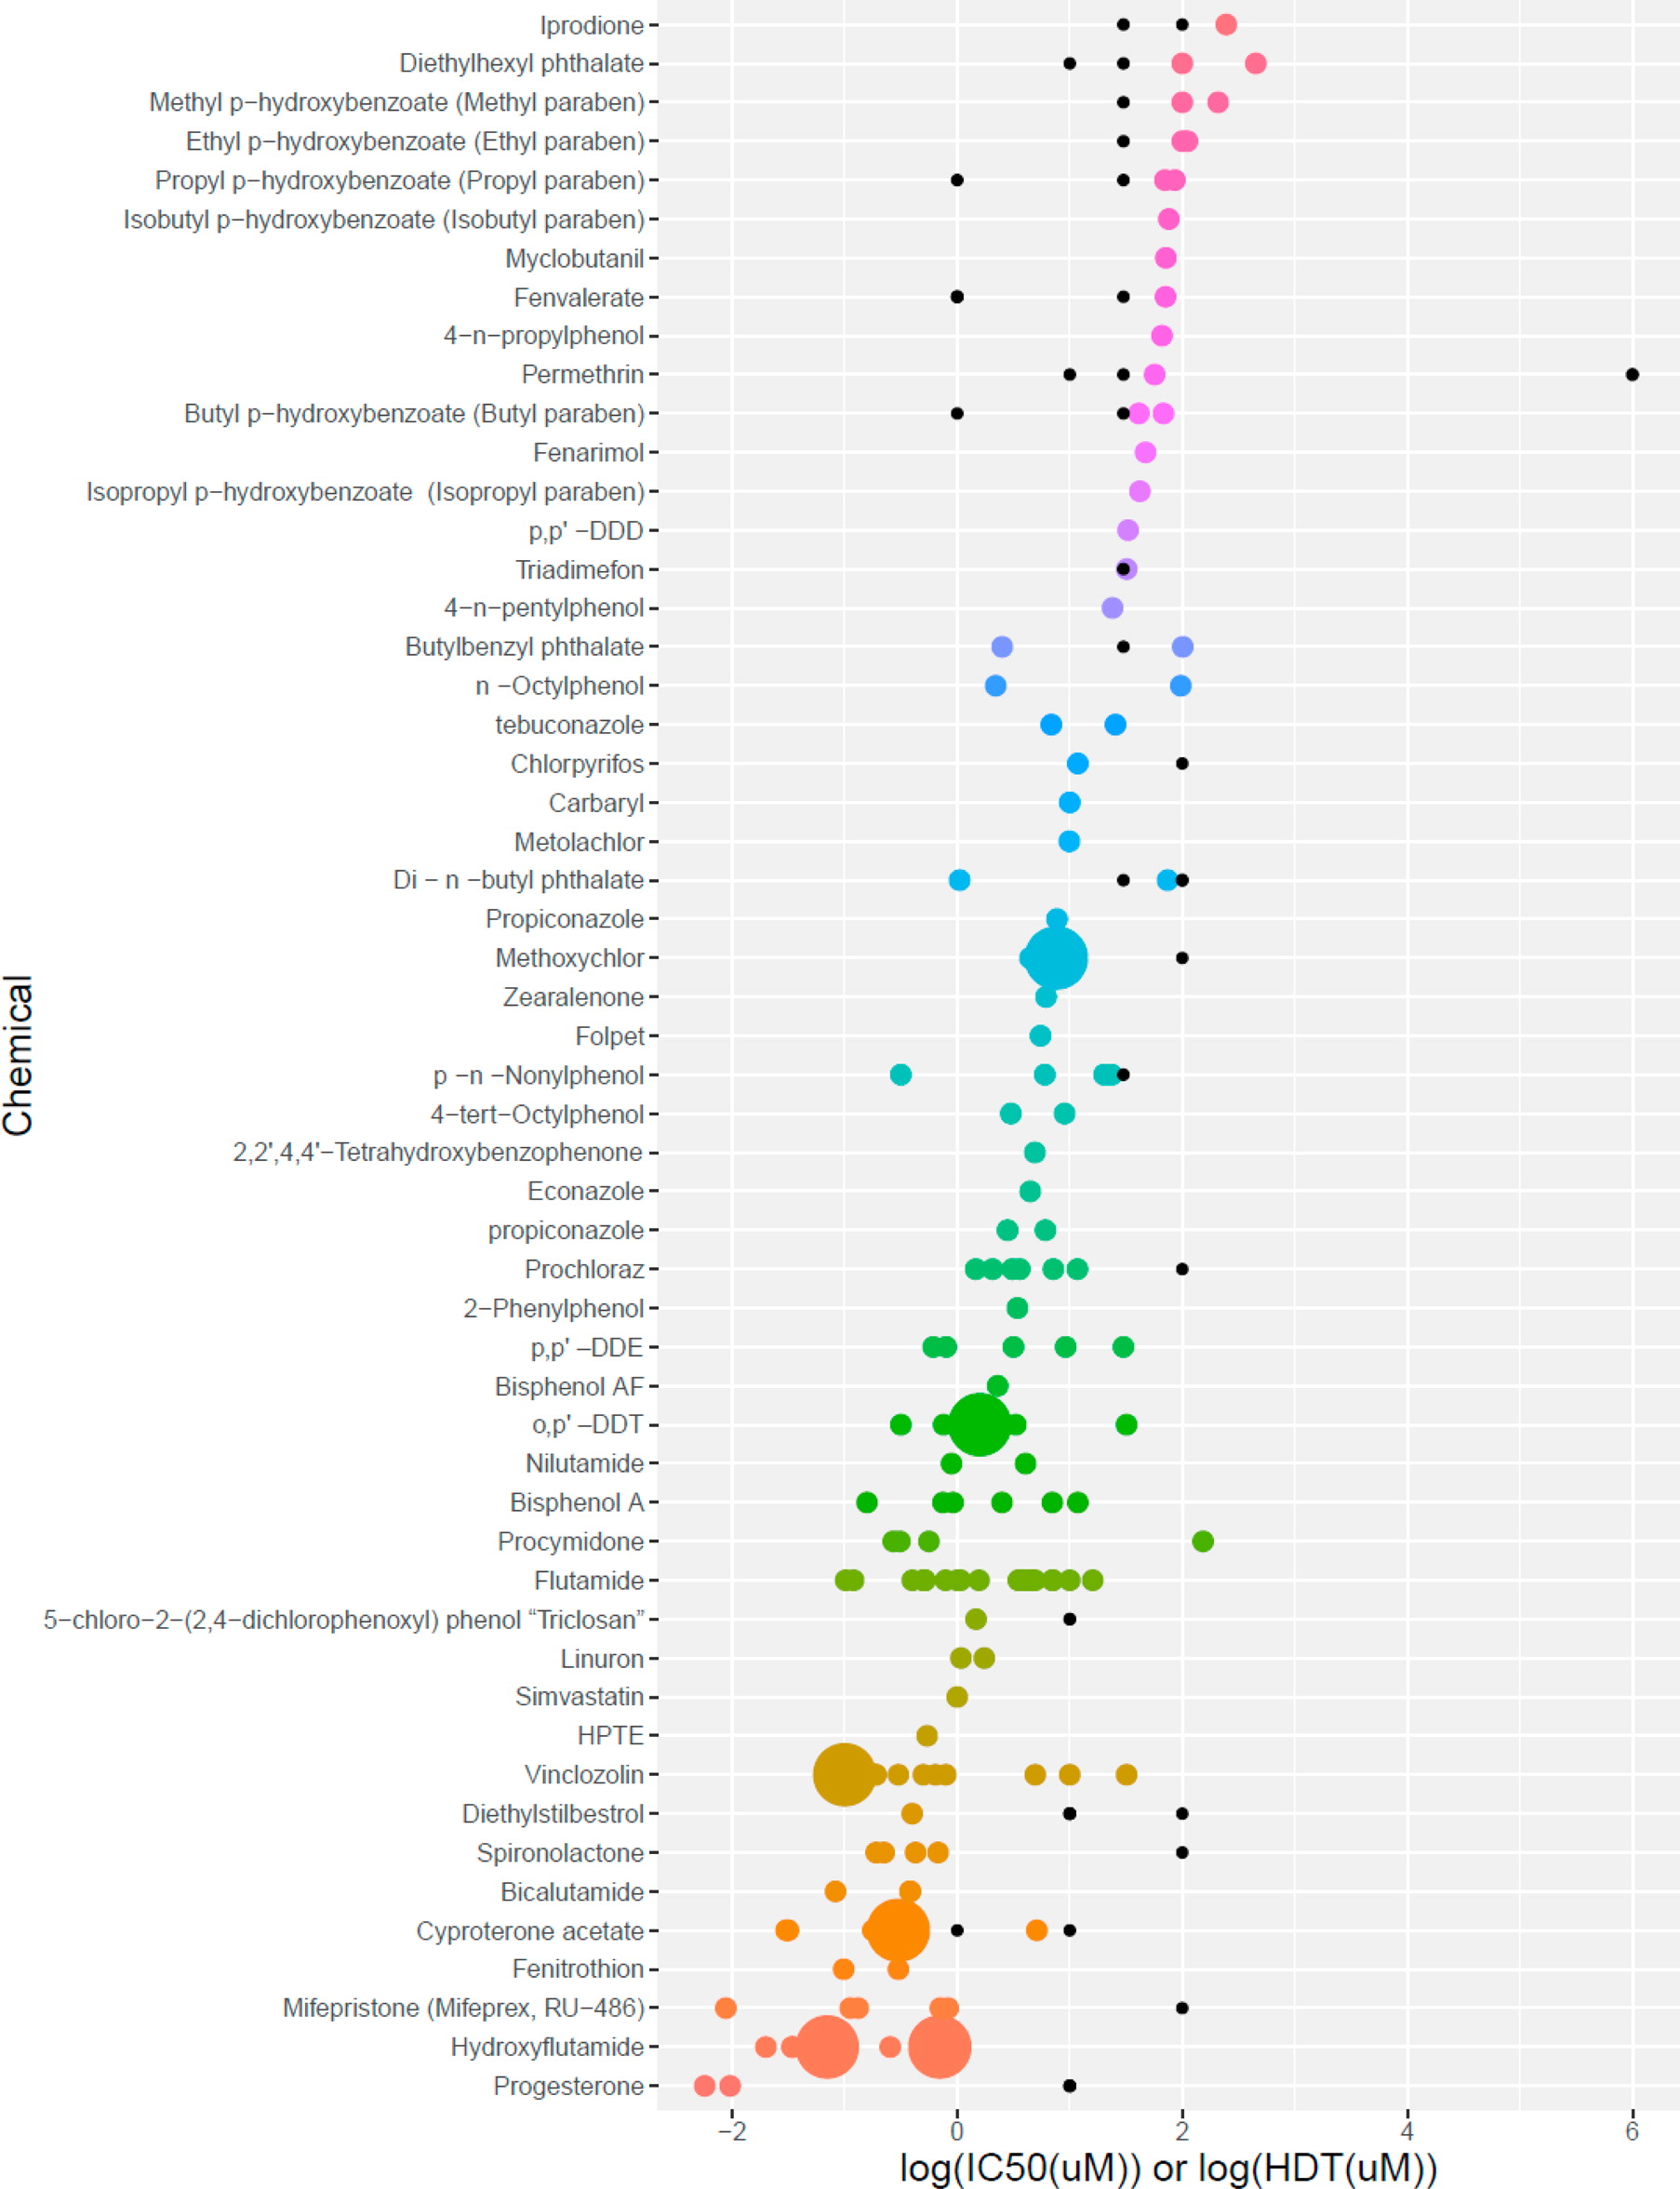
Figure 6. Comparing AR transactivation antagonist results
Chemicals are listed along the x-axes, and the log transformed doses are listed along the y-axis. The colored dots represent positive results in log10 (IC50), and the black dots represent negative results in log10 (HDT). The size of the dot increases with the number of observations (range: 1–21). Antagonist potency decreases moving from bottom to top with a total of 54 chemicals described. AR = androgen receptor; HDT = highest dose tested; IC50 = half-maximal inhibitory concentration.
- Figure 6 (521 KB)
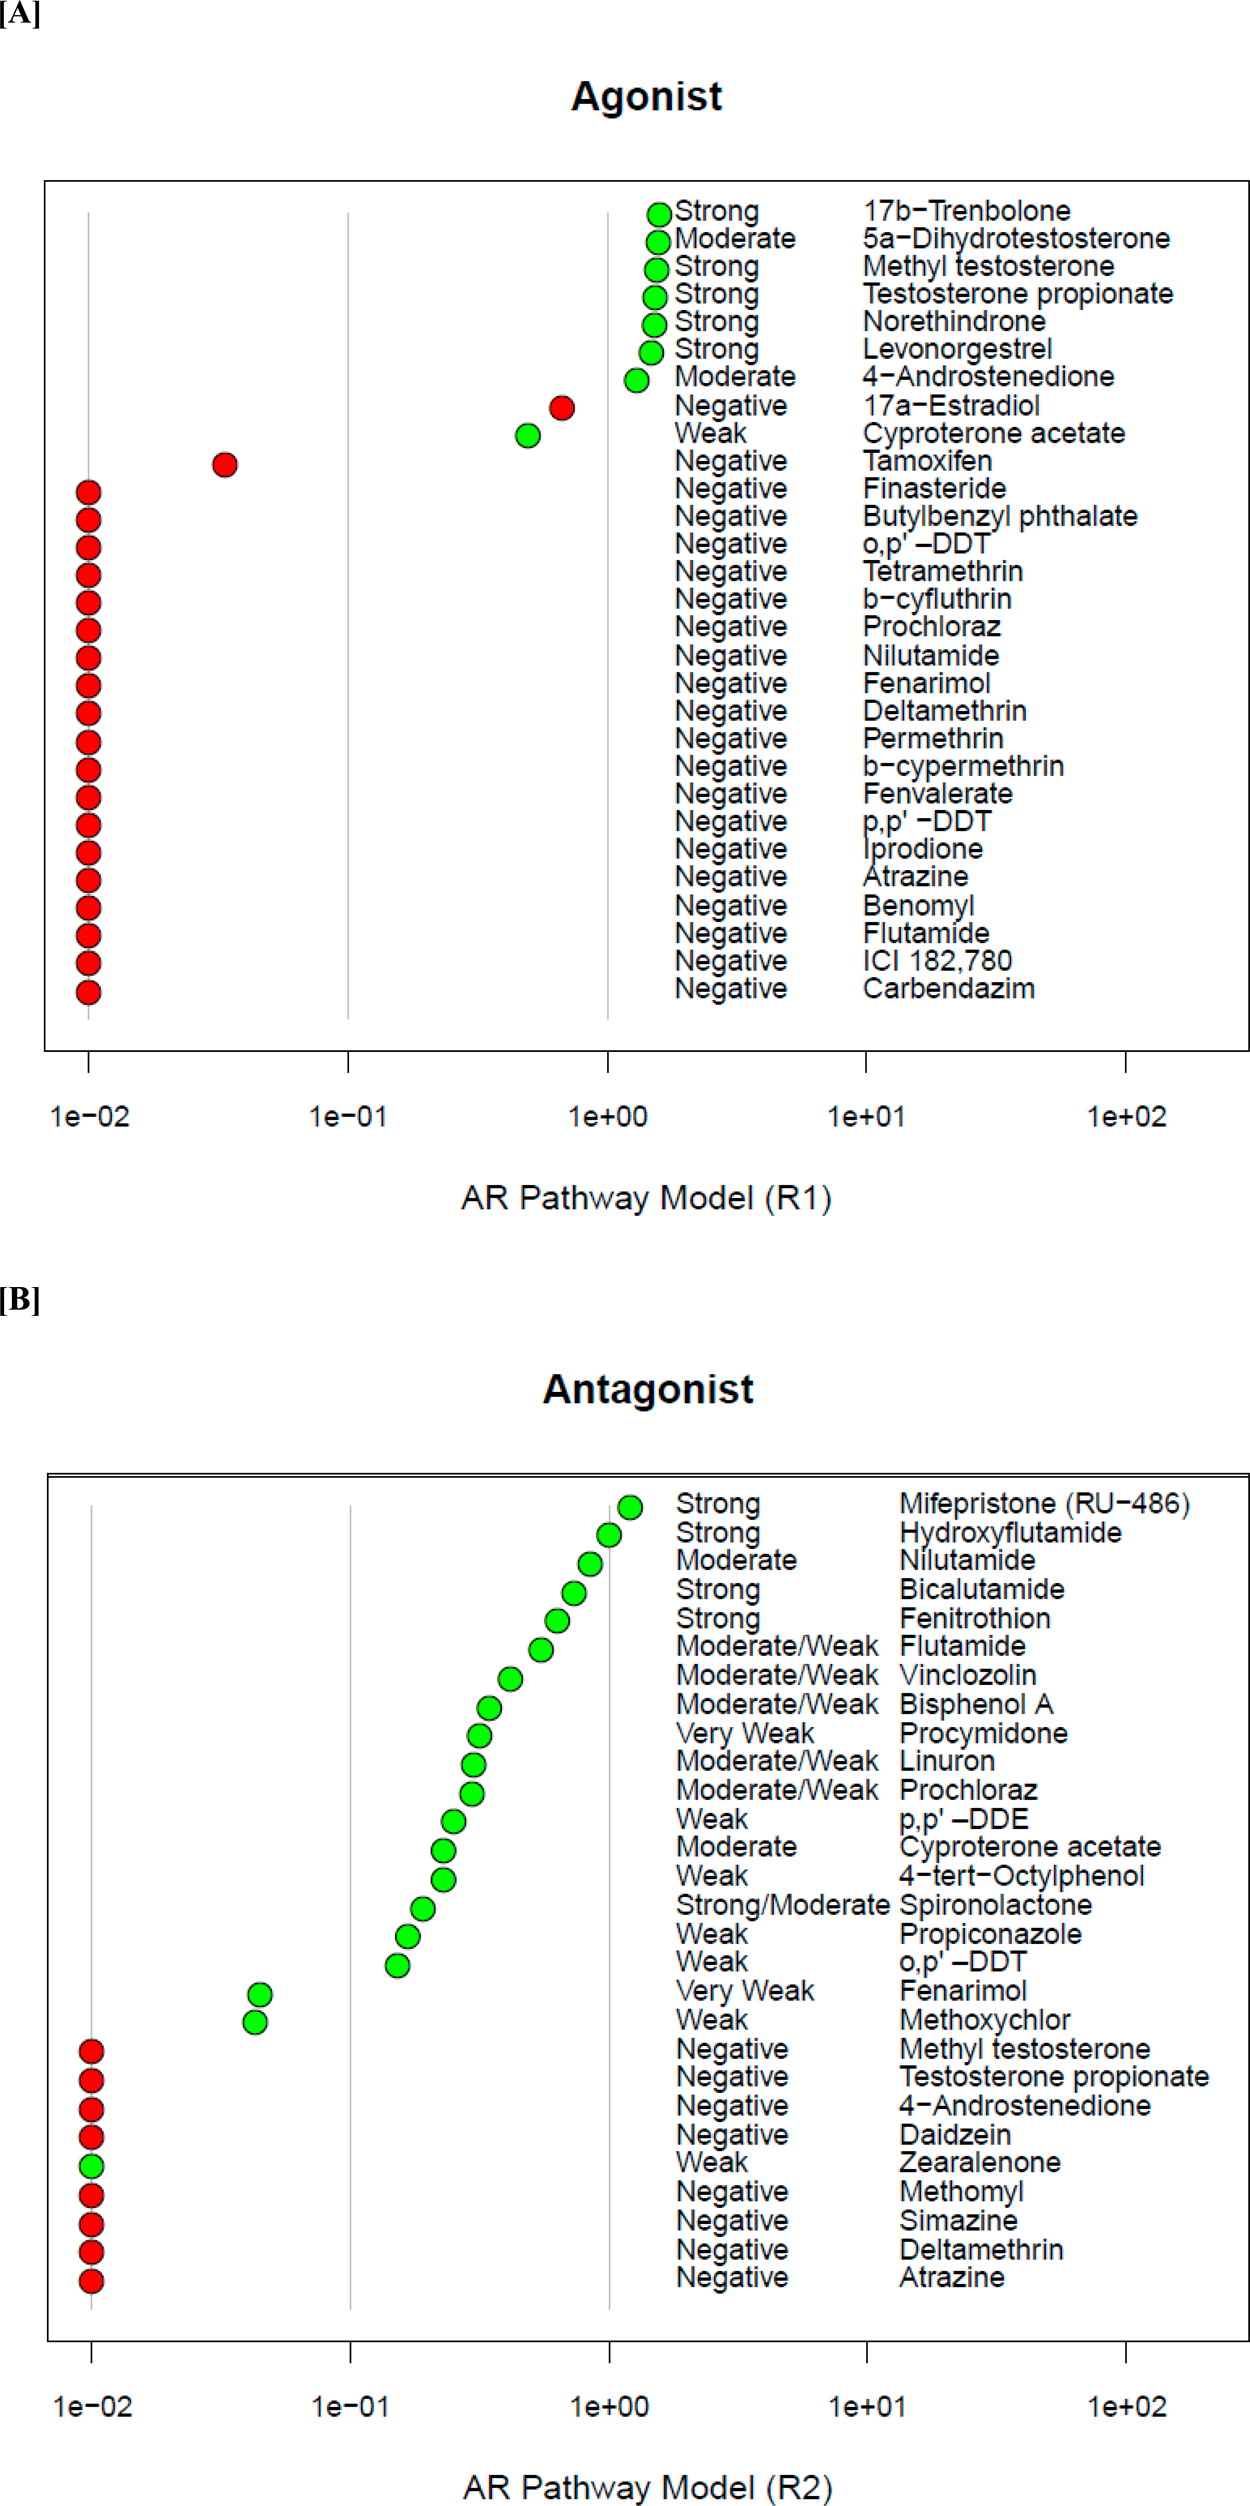
Figure 7. AR pathway model results for reference chemicals
Reference chemicals and associated potency categories (from the literature search) are listed along the y-axes, and the AR pathway model AUC score for (a) agonism (R1) or (b) antagonism (R2) are listed along the x-axes. Green dots represent positive reference chemicals, and red dots represent negative reference chemicals. AR pathway model scores below 0.01 were truncated at 0.01 for plotting purposes. There was one false positive for agonism (17a-estradiol), and one negative agonist reference chemical with an inconclusive model score (tamoxifen). The initial false negative for antagonism (zearalenone) was confirmed as a potential true positive by the antagonist confirmation assay (Tox21_AR_LUC_MDAKB2_Antagonist-confirmation). Two antagonist reference chemicals had AUC scores in the inconclusive region.
- Figure 7 (562 KB)
Figure 8. Concentration response curves and AR pathway model results
Concentration response curves and AR pathway model results for selected reference chemicals. For each chemical, the left-hand panel shows the concentration response data for the 11 in vitro assays, colored by assay group as defined in the legend. The right-hand panel shows the magnitude of the modeled “receptor” responses, where the agonist pathway (R1) is in blue and the antagonist pathway (R2) is in red, and the other interference pathways (R3–R7) are colored as defined in the legend. Model AUC values are displayed below the chemical name, and literature-based reference classifications are displayed in the plot. The median cytotoxic concentration for each chemical is indicated by a vertical red line, and the cytotoxicity region (representing 3 median absolute deviations) is indicated by the gray shaded region. A green horizontal bar indicates the median AC50 of the active assays. Similar plots for all chemicals are given in Supplemental File 3.
- Figure 8 (748 KB)
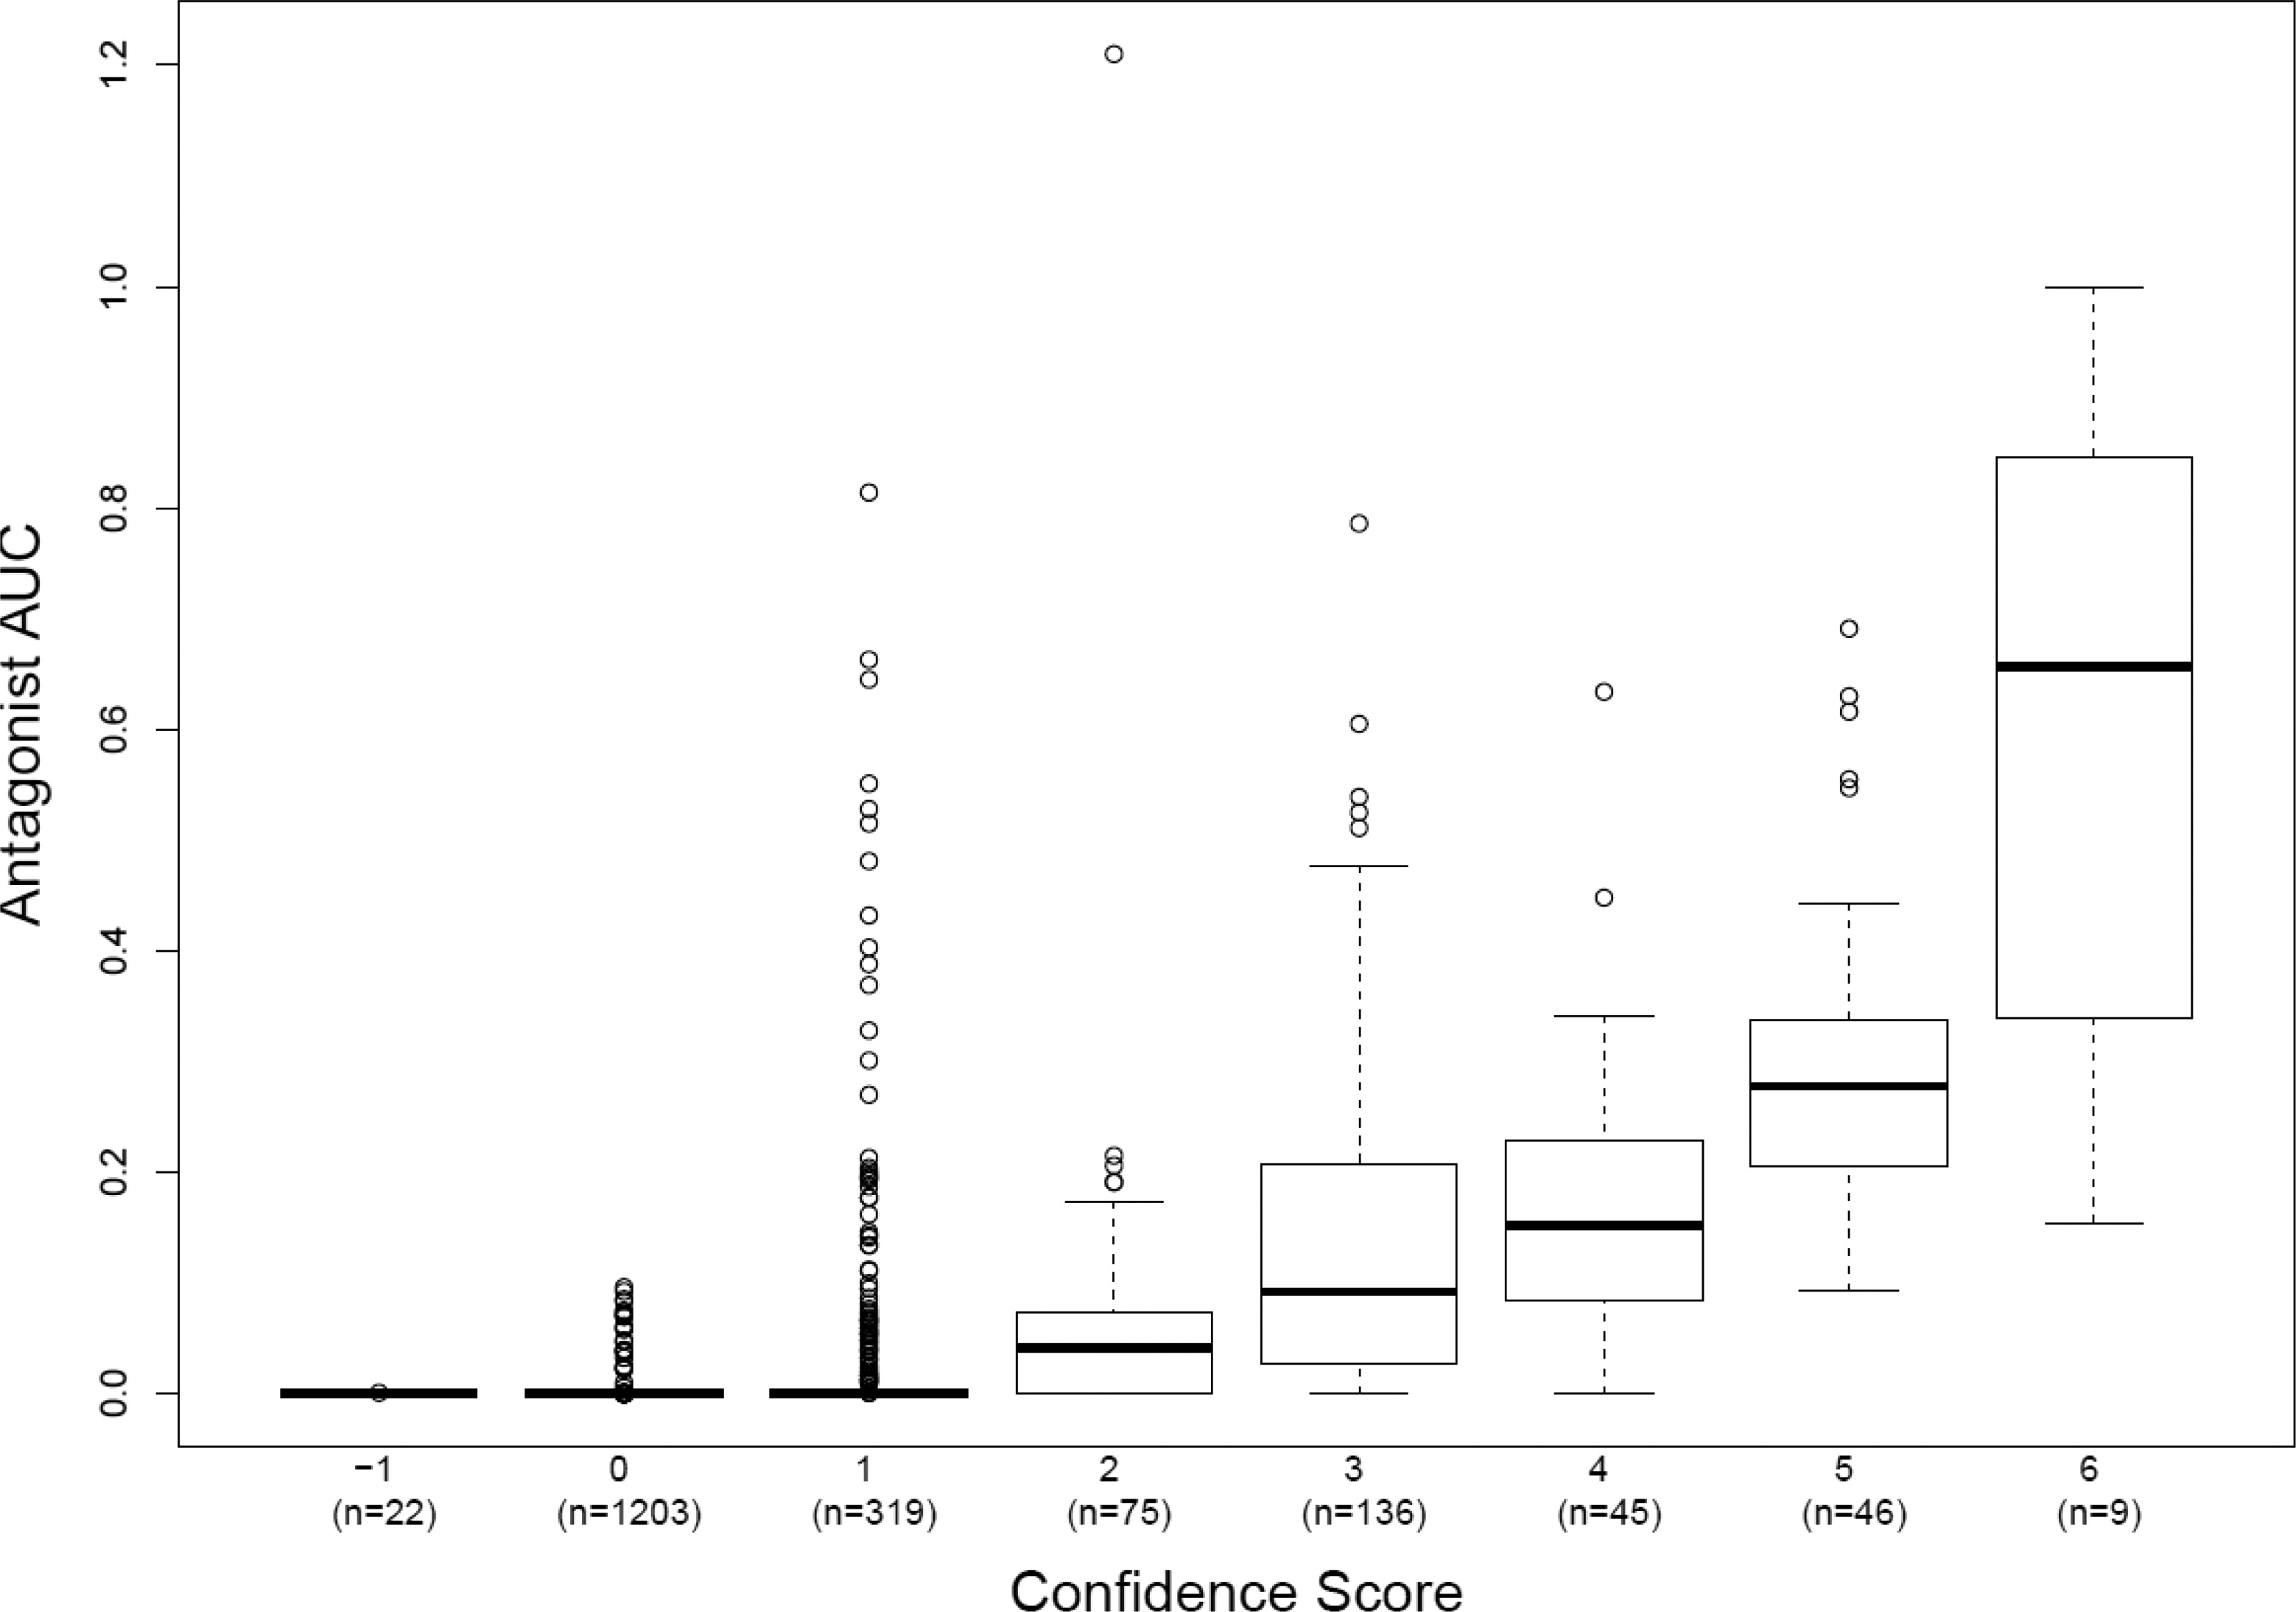
Figure 9. AR pathway model antagonist AUC distribution by confidence score
- Figure 9 (239 KB)
Tables
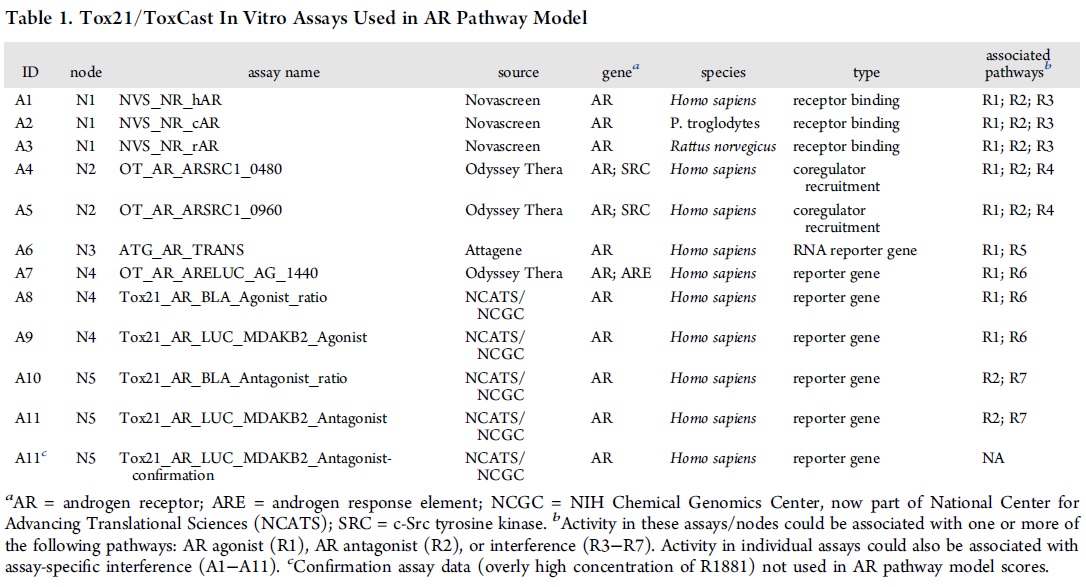
Table 1. Tox21/ToxCast In Vitro Assays Used in AR Pathway Model
aAR = androgen receptor; ARE = androgen response element; NCGC = NIH Chemical Genomics Center, now part of National Center for Advancing Translational Sciences (NCATS); SRC = c-Src tyrosine kinase.
bActivity in these assays/nodes could be associated with one or more of the following pathways: AR agonist (R1), AR antagonist (R2), or interference (R3–R7). Activity in individual assays could also be associated with assay-specific interference (A1–A11).
cConfirmation assay data (overly high concentration of R1881) not used in AR pathway model scores.
- Table 1 (229 KB)
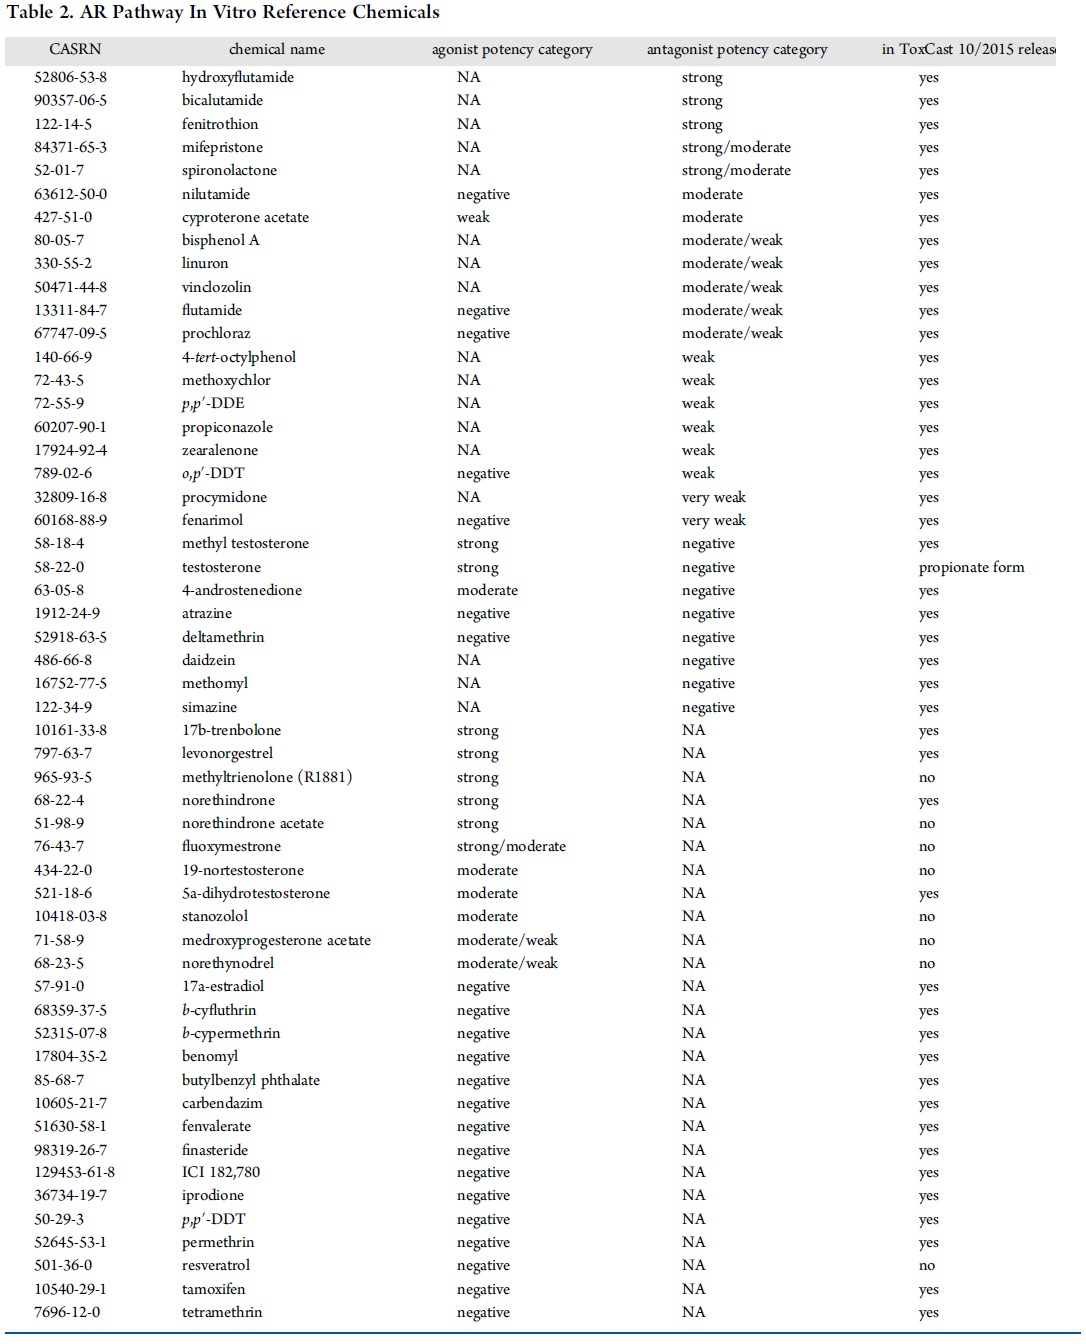
Table 2. AR Pathway In Vitro Reference Chemicals
- Table 2 (312 KB)
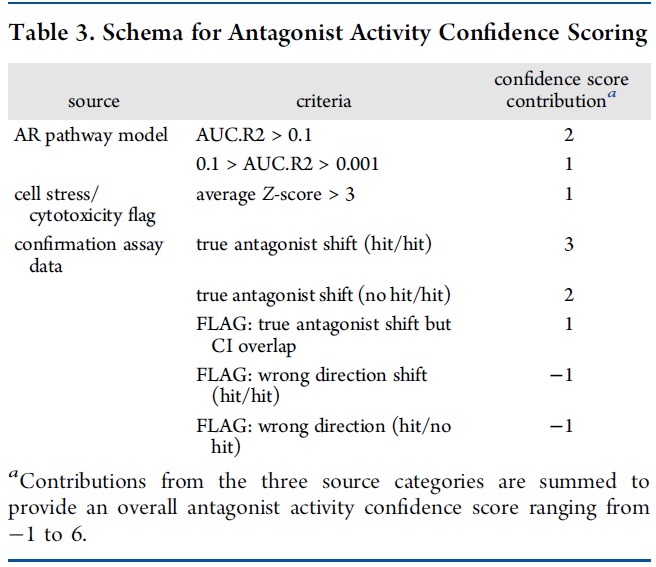
Table 3. Schema for Antagonist Activity Confidence Scoring
aContributions from the three source categories are summed to provide an overall antagonist activity confidence score ranging from −1 to 6.
- Table 3 (107 KB)
Supplemental Materials
Supplemental Data
- Supplemental File 1: Results for the AR Pathway Model and Literature Search (1 MB)
- Supplemental File 2: Comparison of the Results for the Chemical Groups (901 KB)
- Supplemental File 3: AR Reference Literature Database (1 MB)
- Supplemental File 4: AR Pathway Model (2 MB)
- Supplemental File 5: Results of the AR Pathway Model 1855 chemicals (8 MB)
- Supplemental File 6: Cytotoxicity Filtering Information (418 KB)
- Supplemental File 7: Data on Comparisons between EDSP Tier 1 Binding Assays (19 KB)