

Real-time Cell Toxicity Profiling of Tox21 10K Compounds Reveals Cytotoxicity Dependent Toxicity Pathway Linkage
Hsieh JH, Huang R, Lin JA, Sedykh A, Zhao J, Tice RR, Paules RS, Xia M, Auerbach SS.
PLoS One (2017)
DOI: https://doi.org/10.1371/journal.pone.0177902
PMID: 28531190
Publication
Abstract
Cytotoxicity is a commonly used in vitro endpoint for evaluating chemical toxicity. In support of the U.S. Tox21 screening program, the cytotoxicity of ~10K chemicals was interrogated at 0, 8, 16, 24, 32, & 40 hours of exposure in a concentration dependent fashion in two cell lines (HEK293, HepG2) using two multiplexed, real-time assay technologies. One technology measures the metabolic activity of cells (i.e., cell viability, glo) while the other evaluates cell membrane integrity (i.e., cell death, flor). Using glo technology, more actives and greater temporal variations were seen in HEK293 cells, while results for the flor technology were more similar across the two cell types. Chemicals were grouped into classes based on their cytotoxicity kinetics profiles and these classes were evaluated for their associations with activity in the Tox21 nuclear receptor and stress response pathway assays. Some pathways, such as the activation of H2AX, were associated with the fast-responding cytotoxicity classes, while others, such as activation of TP53, were associated with the slow-responding cytotoxicity classes. By clustering pathways based on their degree of association to the different cytotoxicity kinetics labels, we identified clusters of pathways where active chemicals presented similar kinetics of cytotoxicity. Such linkages could be due to shared underlying biological processes between pathways, for example, activation of H2AX and heat shock factor. Others involving nuclear receptor activity are likely due to shared chemical structures rather than pathway level interactions. Based on the linkage between androgen receptor antagonism and Nrf2 activity, we surmise that a subclass of androgen receptor antagonists cause cytotoxicity via oxidative stress that is associated with Nrf2 activation. In summary, the real-time cytotoxicity screen provides informative chemical cytotoxicity kinetics data related to their cytotoxicity mechanisms, and with our analysis, it is possible to formulate mechanism-based hypotheses on the cytotoxic properties of the tested chemicals.
Figures
Figure 1. Cytotoxicity kinetics data of mitomycin C in HEK293 cell line using glo technology.
a) The percent of activity is plotted as the function of hour. The color represents different concentrations of the chemical. The darker color (redder) is equivalent to higher concentrations. b) The concentration-response data at three representative time points (0, 16, 40 hour). The total effect across concentrations can be summarized as wAUC. c) The total effect (log10(wAUC+1)) is plotted as the function of exposure duration in hours.
- Figure 1 (125 KB)
Figure 2. Examples of two chemicals (digitonin vs. mitomycin C) with different kinetics of cytotoxicity.
Blue: HEK293; red: HepG2. Filled circle (glo); hollow circle (flor); the arrow represents the earliest time interval where the maximum cytotoxic effect was obtained (filled arrow head: glo; hollow arrow head: flor).
- Figure 2 (175 KB)
Figure 3. Comparison of number of actives in four assays.
The number of actives detected in the four assays at the six different time points. Blue: HEK293 cell line; red: HepG2 cell line. Filled circle: glo assay technology; hollow circle: flor assay technology.
- Figure 3 (76 KB)
Figure 4. Toxicity pathway clustering based on chemical cytotoxicity kinetics data.
a) binary association between activities in pathways (rows) and chemical cytotoxicity kinetics groupings(columns). Magenta cell: significant; white cell: non-significant. n_in_bin: number of chemicals in the bin (grouping). b) degree of association between the earliest time intervals where chemicals reached the maximum cytotoxic effect and activity in toxicity pathways. Red row text: stress response pathways; black row text: nuclear receptor related pathways; n: number of times of associations found in a); more intensified purple color, higher degree of association.
- Figure 4 (240 KB)
Figure 5. Activity potency comparison.
a) AR antagonists. b) ER antagonists. Dendrogram on the left represents the clustering using the cytotoxicity kinetics activity data and color represents the groupings; the symbols represent the most potent activity in the respective assays.
- Figure 5 (129 KB)
Tables
Table 1. Number of active chemical overlaps.
Table 1. Number of active chemical overlaps between four assays at 40 hours classified by cell lines and technologies.
- Table 1 (47 KB)
Table 2. Activity correlation between four assays.
- Table 2 (65 KB)
Table 3. Number of chemicals that reached their maximum cytotoxic effect.
Table 3. Number of chemicals that reached their maximum cytotoxic effect in each time interval by assay.
- Table 3 (147 KB)
Supplemental Materials
Supplemental Data
- S1 Dataset: Activity values of the Tox21 chemicals. (7 MB)
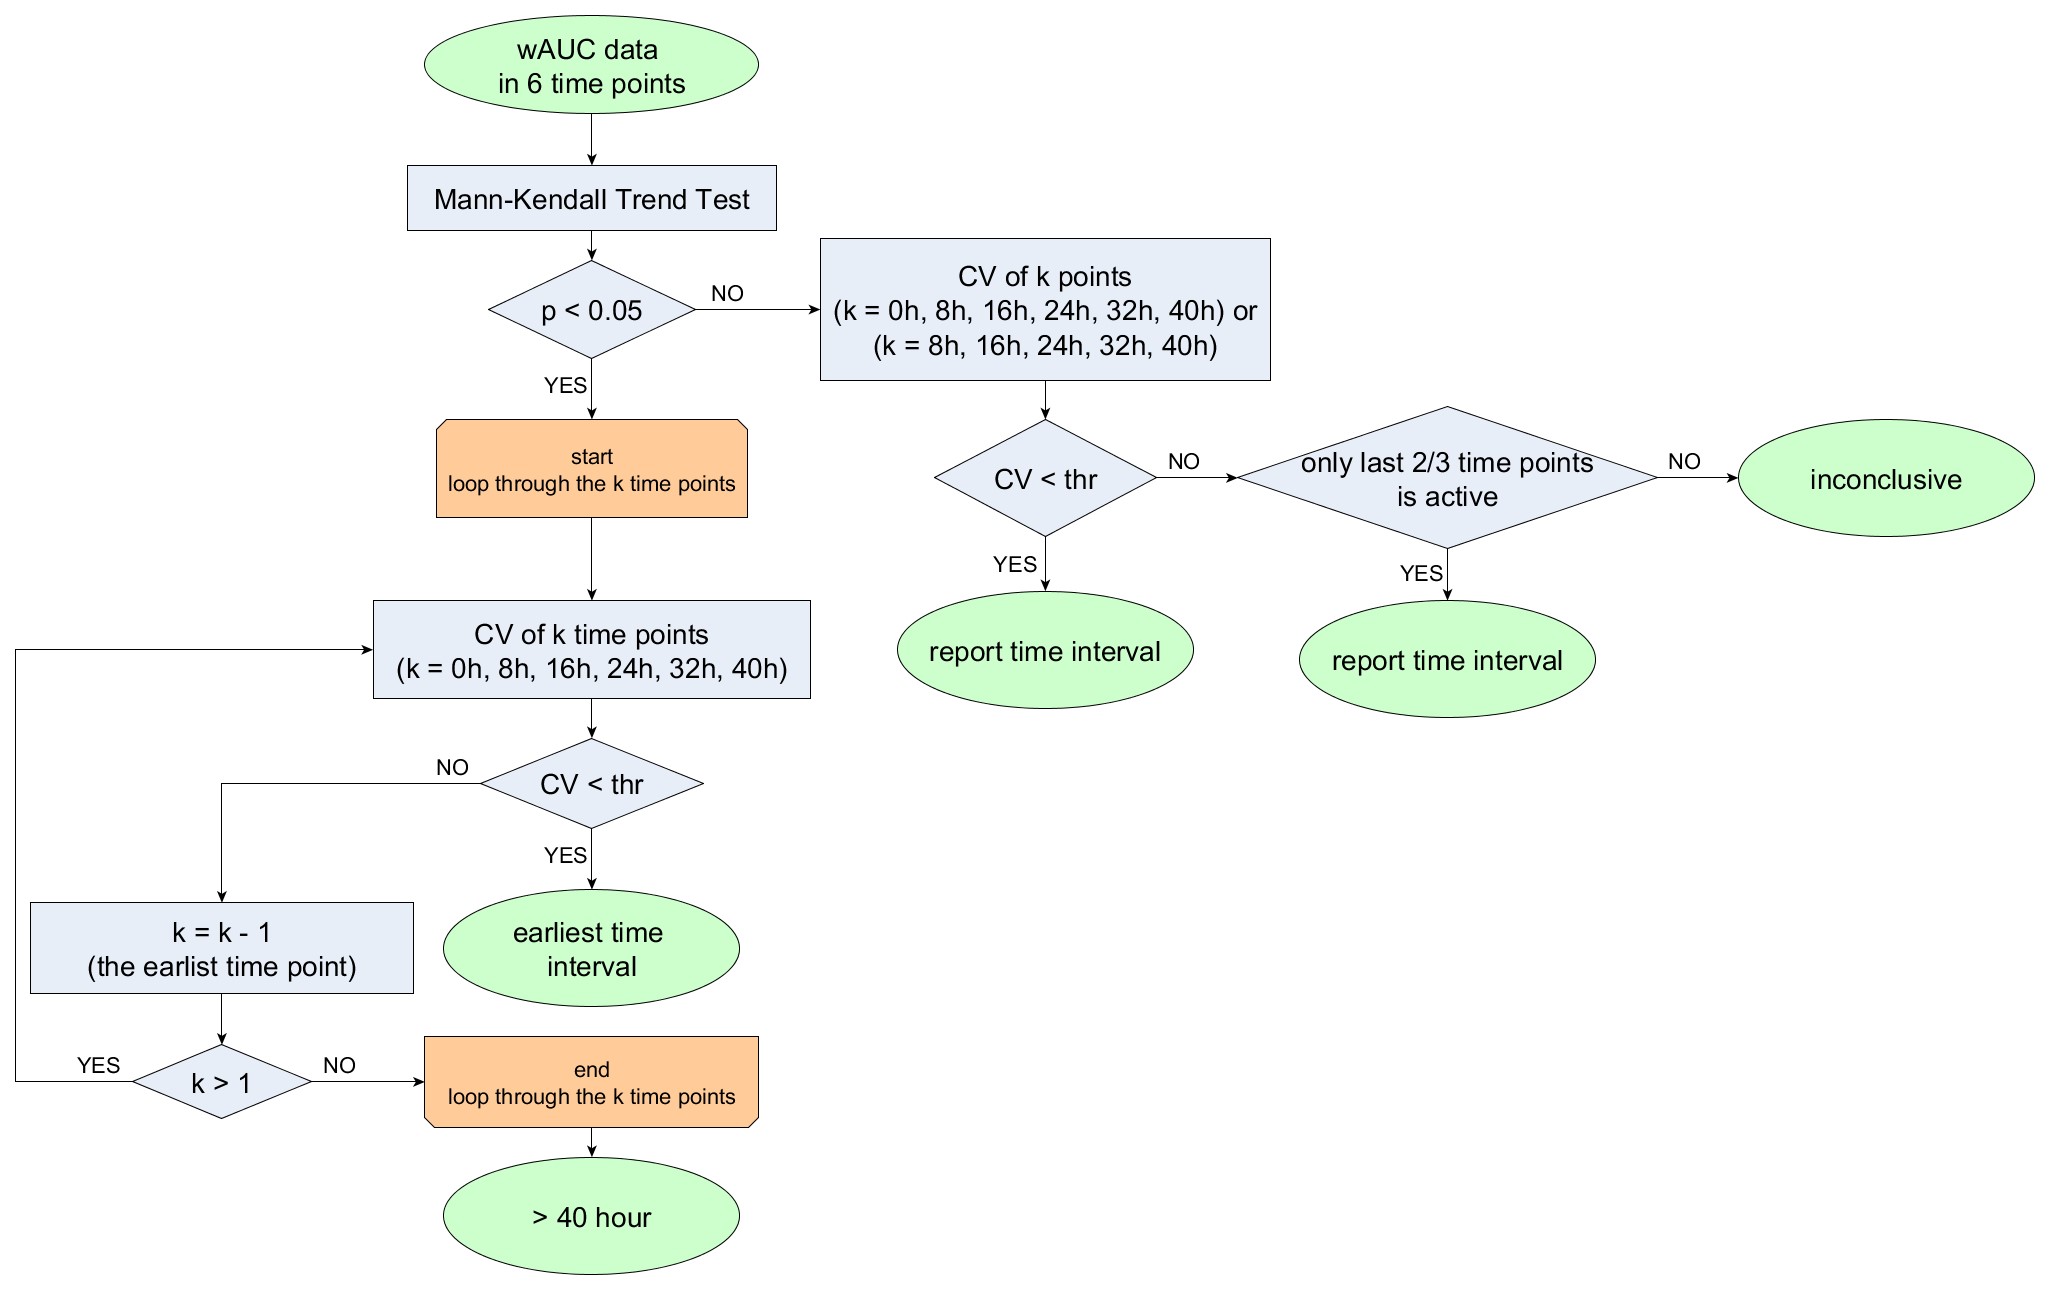
- S1 Figure: Flowchart to identify the earliest time interval where the maximum cytotoxic effect of chemical is reached. (194 KB)
- S1 Table: Activity information of the prioritized potent AR antagonists. (25 KB)
- S1 Text. Tables: Tox21 assays used in the enrichment analysis; Assay performance evaluation; Number of actives at each time point and the fold change of actives between two consecutive time points. (47 KB)
- S2 Figure: The Venn diagram [40] of the number of actives at the 40-hour time point. (45 KB)
- S2 Table: Activity information of the prioritized potent ER antagonists. (23 KB)
- S3 Figure: Hierarchical clustering of toxicity pathways based on the activity similarity of chemicals. (20 KB)
- S4 Figure: Cytotoxicity kinetics of the representative nuclear receptor antagonists in the clusters. (907 KB)
- S5 Figure: Prioritized chemicals based on identified cytotoxicity dependent toxicity pathway linkages. (187 KB)