

Combination of Multiple Neural Crest Migration Assays to Identify Environmental Toxicants from a Proof-of-Concept Chemical Library
Nyffeler J, Dolde X, Krebs A, Pinto-Gil K, Pastor M, Behl M, Waldmann T, Leist M.
Archives of Toxicology (2017)
DOI: https://doi.org/10.1007/s00204-017-1977-y
PMID: 28477266
Publication
Abstract
Many in vitro tests have been developed to screen for potential neurotoxicity. However, only few cell function-based tests have been used for comparative screening, and thus experience is scarce on how to confirm and evaluate screening hits. We addressed these questions for the neural crest cell migration test (cMINC). After an initial screen, a hit follow-up strategy was devised. A library of 75 compounds plus internal controls (NTP80-list), assembled by the National Toxicology Program of the USA (NTP) was used. It contained some known classes of (developmental) neurotoxic compounds. The primary screen yielded 23 confirmed hits, which comprised ten flame retardants, seven pesticides and six drug-like compounds. Comparison of concentration–response curves for migration and viability showed that all hits were specific. The extent to which migration was inhibited was 25–90%, and two organochlorine pesticides (DDT, heptachlor) were most efficient. In the second part of this study, (1) the cMINC assay was repeated under conditions that prevent proliferation; (2) a transwell migration assay was used as a different type of migration assay; (3) cells were traced to assess cell speed. Some toxicants had largely varying effects between assays, but each hit was confirmed in at least one additional test. This comparative study allows an estimate on how confidently the primary hits from a cell function-based screen can be considered as toxicants disturbing a key neurodevelopmental process. Testing of the NTP80-list in more assays will be highly interesting to assemble a test battery and to build prediction models for developmental toxicity.
Figures
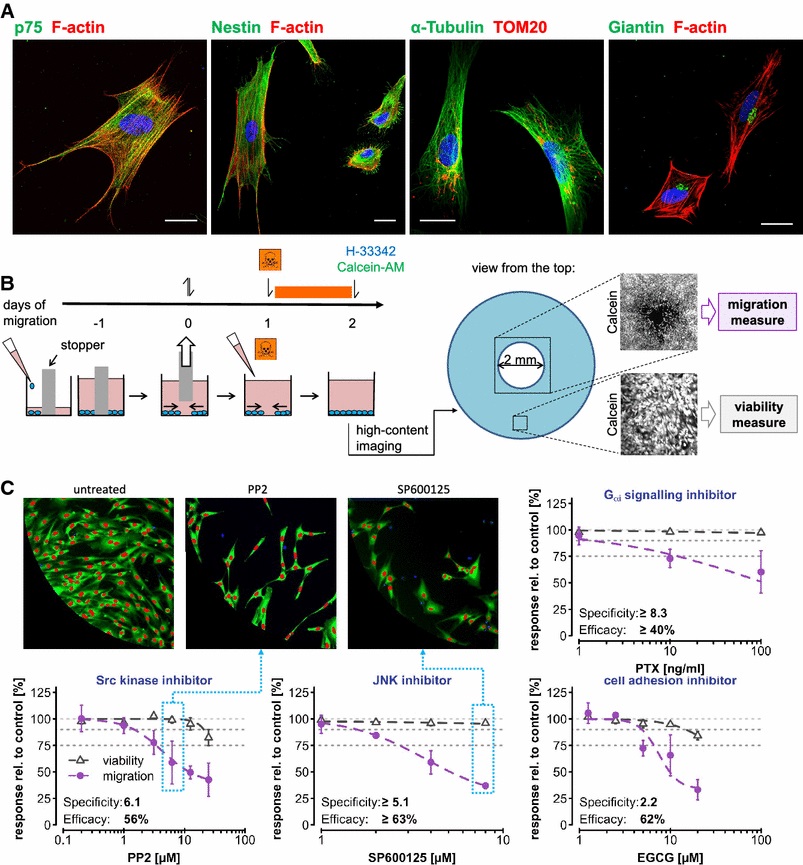
Figure 1. Introduction to the biological system.
a Cryopreserved NCCs were thawed and plated on coverslips. After 2 days, they were fixed, and various cellular structures and markers were stained; H-33342 (depicted in blue) was used to visualise the nuclei. NCCs migrating into cell-free zones were imaged using a confocal microscope. The scale bar corresponds to 25 µm. p75 NCC marker; Nestin stem cell marker; TOM20 mitochondrial marker; Giantin golgi marker. b Graphical representation of the assay scheme: cells were seeded in 96-well plates containing silicone stoppers to create a cell-free circular area. After 1 day, the stoppers were removed, and cells were allowed to migrate for 24 h before the test compounds were added for additional 24 h. For imaging with an automated screening microscope, cells were visualised using H-33342 (intercalates into DNA) and calcein-AM (fluorescent in viable cells only). Imaging of the central zone allowed the quantification of cell migration; the cell viability was determined from images of the well periphery. c Examples for endpoint-specific controls. The known biological activities of the test compounds are indicated on top of the diagrams in blue. The light grey dotted line indicates the 100% value. The other two grey lines are drawn at 90 and 75% to indicate thresholds for reduced viability and migration, respectively. All values are normalised to untreated controls. Data are mean ± SD from three experiments. In the microscopy images, the viable cells are displayed in green and nuclei of viable cells in red (colour figure online)
- Figure 1 (230 KB)
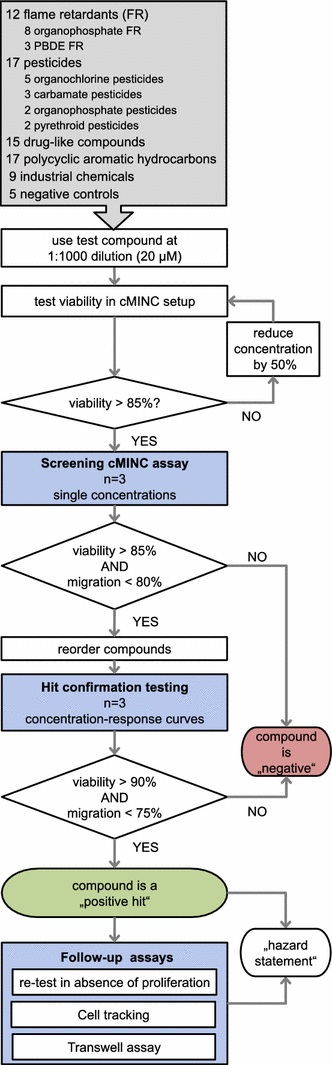
Figure 2. Overview of the testing scheme leading from initial screen to hazard statement.
In a first phase, the highest non-cytotoxic concentration was assessed in an iterating procedure. Then, the migration assay was performed (three independent runs) and compounds were classified either as potential hits or as ‘inactives’. Subsequently, concentration–response curves were obtained for the potential hit compounds. The confirmed hits were then further characterised using three follow-up assays. The decision points required that at least one concentration had to fit the indicated decision criterion. The “hazard statement” is meant to imply a concentration range at which effects on NCC are to be expected and a measure of confidence in the screen assay results. PBDE polybrominated diphenyl ether
- Figure 2 (120 KB)
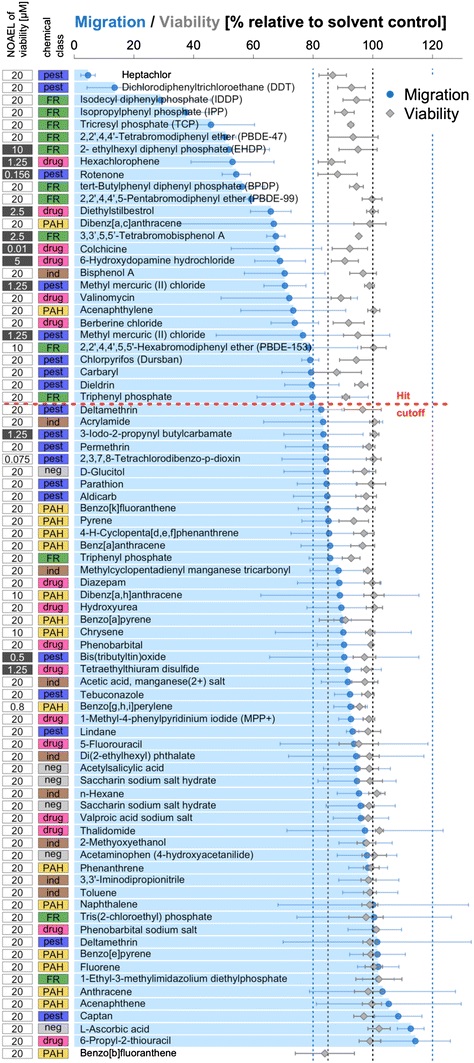
Figure 3. Results of the screening.
Compounds were screened according to the procedure indicated in Fig. 2 at a 1:1000 dilution (mostly 20 µM) if they were not cytotoxic at this concentration. Otherwise, they were tested at the highest non-cytotoxic concentration. Compounds are ordered according to the screen results from most migration-inhibiting (top) to least migration-inhibiting. For each compound, viability (grey diamonds) and migration (blue circles) at the highest tested non-cytotoxic concentration are displayed. The vertical lines are at 80, 85, 100, 120% of control and indicate the thresholds for viability (grey) and migration (blue). Compounds reducing migration by ≥20% underwent subsequent hit confirmation testing. For one compound (benzo[b]fluoranthene), migration could not be evaluated due to interference of the chemical with the fluorophores of the test. The chemical classes of the compounds were FR flame retardant, PAH polycyclic aromatic hydrocarbon, ind industrial chemical, pest pesticide, drug drug-like compound, neg negative control. On the left side of the overview, the NOAEL of viability is displayed in a white box for compounds not cytotoxic at the highest tested concentration (i.e. the NOAEL is greater than the given value) and in a grey box for all other compounds (colour figure online)
- Figure 3 (253 KB)
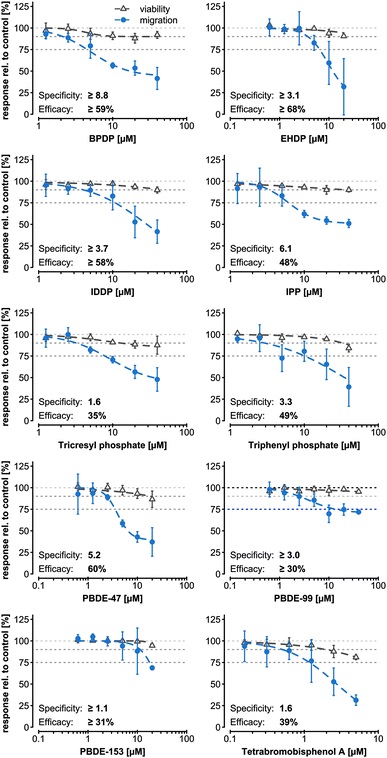
Figure 4. Hit confirmation with the primary assay: flame retardants.
Compounds identified as potential hits in the screen were re-ordered and concentration–response curves were obtained for viability (grey triangles) and migration (blue circles). All values are normalised to the solvent control (0.1% DMSO). The horizontal light grey dotted line indicates 100% value for easier reading of the diagrams. The other two grey lines are drawn at 90 and 75% to indicate the threshold for reduced viability and migration, respectively. A log-logistic function with constraints was fitted to the concentration–response curve and the EC90 of viability and the EC75 of migration were intrapolated. The ratio between these two values was termed ‘specificity’, whereas ‘efficacy’ was defined as the amount of migration-inhibition at the EC90 of viability. Data are mean ± SD from three experiments (colour figure online)
- Figure 4 (117 KB)
Figure 5. Hit confirmation with the primary assay: drug-like compounds and pesticides.
a, b Compounds identified as potential hits in the screen were re-ordered and concentration–response curves were obtained for viability (grey triangles) and migration (blue circles). All values are normalised to the solvent control (0.1% DMSO). The horizontal light grey dotted line indicates the 100% value for easier reading of the diagrams. The other two grey lines are drawn at 90 and 75% to indicate the threshold for reduced viability and migration, respectively. A log-logistic function with constraints was fitted to the concentration–response curve and the EC90 of viability and the EC75 of migration were intrapolated. The ratio between these two values was termed ‘specificity’, whereas ‘efficacy’ was defined as the amount of migration-inhibition at the EC90 of viability. To compare the results with other compounds, the data of valinomycin were normalised to 100% (i.e. multiplied with 100/89). Data are mean ± SD from three experiments. c Two isomers of dichlorodiphenyltrichloroethane (DDT) and the commercial DDT mixture were retested in the cMINC assay (5 µM). Data are mean ± SD from three experiments. op-DDT 2,4′-DDT, pp-DDT 4,4′-DDT
- Figure 5 (118 KB)
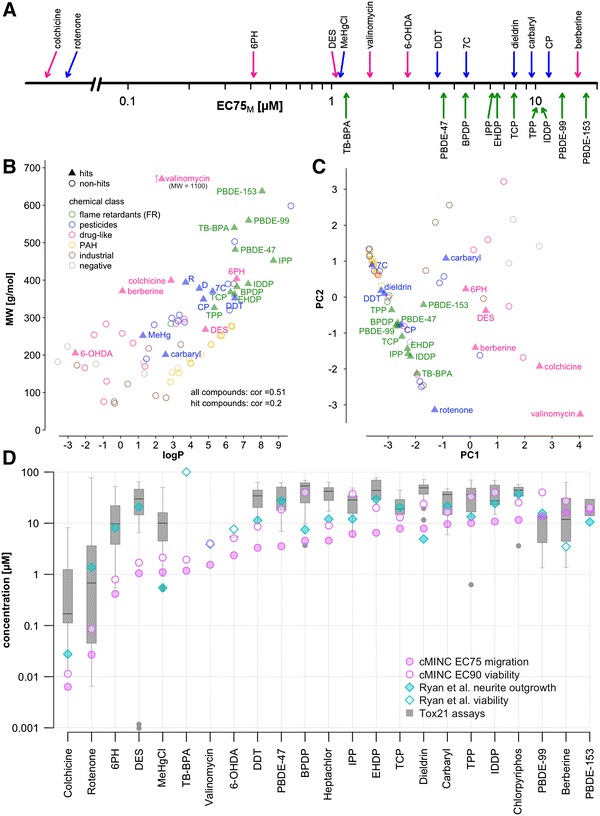
Figure 6. Representation of the library in the chemical space and comparison to published data.
a Schematic indicating the potencies of the confirmed hits displayed as EC75 of migration, i.e. the concentration at which migration was reduced by 25%. b Library compounds are represented according to their molecular weight (MW) and the partition coefficient (logP). c Grid-independent descriptors were calculated for 8298 compounds of the Tox21 library and for the screen library used here. A principal component analysis was performed for the Tox21 compounds and the library compounds tested in our study were displayed in the background of the Tox21 principal component space along the first two dimensions. 6-OHDA 6-hydroxydopamine hydrochloride, 6PH hexachlorophene, 7C heptachlor, CP chlorpyriphos, D dieldrin, DES diethylstilbestrol, R rotenone, TB-BPA 3,3′,5,5′-tetrabromobisphenol A. d Comparison of the hit-confirmation data (violet circles) with results from a neurite outgrowth assay (turquoise diamonds) and with a broad set of Tox21 assays (grey boxes and points), with individual endpoint data of active assays compiled in the form of boxplots (Ryan et al. 2016). For neurite outgrowth data, the most sensitive endpoint from various neurite outgrowth endpoints and viability measurement is displayed (colour figure online)
- Figure 6 (131 KB)
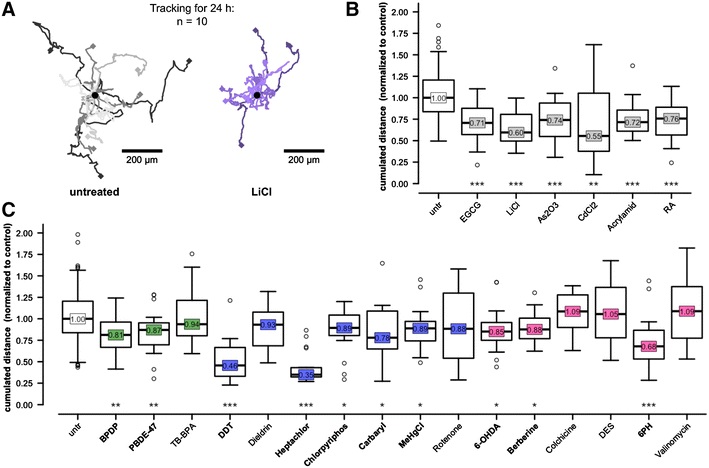
Figure 7. Cell tracking as follow-up assay.
Cells (plated at standard cMINC conditions) were imaged during the 24-h treatment period to assess the cumulated travelled distance of individual cells by manual tracking. a Visualisation of cell tracks for untreated cells and cells treated with 20 mM LiCl. b Establishment of the cell tracking assay using endpoint-specific controls and compounds known to inhibit NCC migration in the cMINC assay. For each treatment condition, 20 individual cells were tracked and the cumulated travelled distance was normalised to the untreated control. The box represents the first and third quartiles, the black line the median (number given in the rectangle) and the whiskers are at an interquartile range of 1.5. c Performance of the screen hits in the cell tracking assay: green flame retardants; blue pesticides; pink drug-like compounds. Data are from two independent biological experiments, i.e. the box represents data from 20 tracked cells. Statistical significance of differences between treated and non-treated conditions was calculated using a Wilcoxon rank sum test. Statistical indicators are given below the boxes *p < 0.05, **p < 0.01, ***p < 0.001. Names of screen compounds that reduced the speed of migration are bold. EGCG epigallocatechin gallate, RA retinoic acid, TB-BPA 3,3′,5,5′-tetrabromobisphenol A, 6-OHDA 6-hydroxydopamine hydrochloride, DES diethylstilbestrol, 6PH hexachlorophene (colour figure online)
- Figure 7 (90 KB)
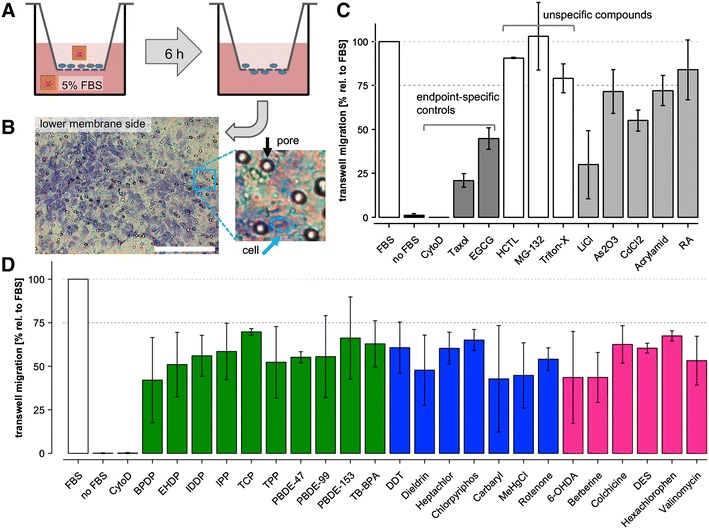
Figure 8. Transwell migration assay as follow-up assay.
a Schematic indicating the assay principle: cells were plated into transwell inserts and stimulated to migrate with 5% foetal bovine serum (FBS) in the lower compartment. Test items were added to both compartments. After 6 h, cells were fixed, stained and the number of cells that migrated through the transwell membrane were manually counted. b Exemplary microscopy image of migrated cells (purple blotches) on the lower surface of the membrane. The scale bar corresponds to 150 µm. c Benchmarking of the transwell assay with endpoint-specific controls (dark grey), unspecific compounds (white) and compounds well established to inhibit NCC migration in the cMINC assay (light grey). Transwell migration is measured as the number of migrated cells relative to cells stimulated with 5% FBS alone. The dotted grey line at 75% separates unspecific compounds from endpoint-specific controls. Data are expressed as mean ± SD from at least two independent biological experiments. d Performance of the screen hits in the transwell migration assay: green flame retardants; blue pesticides; pink drug-like compounds. Data are expressed as mean ± SD from three independent biological experiments. FBS foetal bovine serum, CytoD cytochalasin D, EGCG epigallocatechin gallate, HCTLl-homocysteine thiolactone, RA retinoic acid, TB-BPA 3,3′,5,5′-tetrabromobisphenol A, 6-OHDA 6-hydroxydopamine hydrochloride, DES diethylstilbestrol (colour figure online)
- Figure 8 (143 KB)
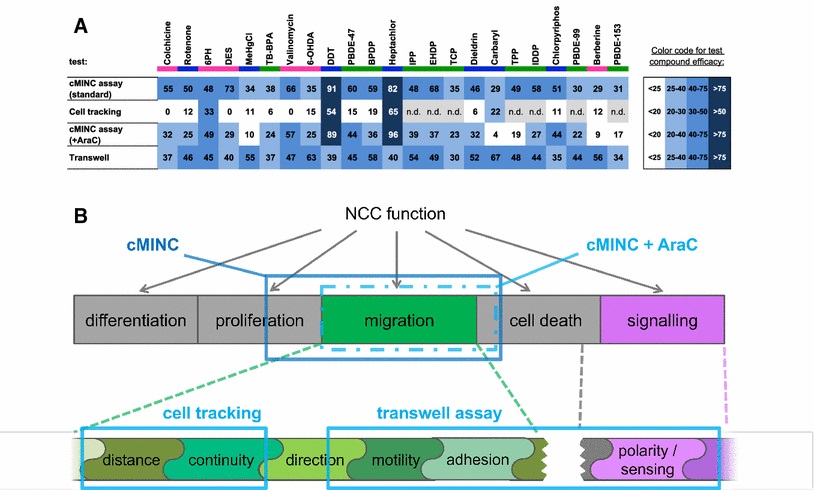
Figure 9. Summary of assay data and biological features captured.
The results of the cMINC assay, the re-testing in absence of proliferation, the transwell assay and the cell tracking were summarised in tabular form. The colour code is explained in the legend to the right. Briefly: white indicates a lack of effect. The intensity of blue indicates the efficacy. n.d. not determined, TB-BPA 3,3′,5,5′-tetrabromobisphenol A, 6-OHDA 6-hydroxydopamine hydrochloride, DES diethylstilbestrol, 6PH hexachlorophene. b The diagram indicates biological processes captured by the different assays. The top band indicates various NCC functions. The blue boxes indicate which NCC functions are captured by the different assays. The bottom band is an expansion from the upper band, with a focus on signalling and different migration subfunctions. The blue boxes indicate which functions are measured by the cell tracking and transwell assays
- Figure 9 (130 KB)
Supplemental Materials
Supplementary Material
- Supplementary Material 1 (340 KB)
- Supplementary Material 2 (1 MB)