

The TGx-28.65 Biomarker Online Application for Analysis of Transcriptomics Data to Identify DNA Damage-inducing Chemicals in Human Cell Cultures
Jackson MA, Yang L, Lea IA, Rashid A, Kuo B, Williams A, Yauk CL, Fostel J.
Environ Mol Mutagen. (2017)
DOI: https://doi.org/10.1002/em.22114
PMID: 28766826
Publication
Abstract
The TGx-28.65 biomarker is a 65-gene expression profile generated from testing 28 model chemicals (13 that cause DNA damage and 15 that do not) in human TK6 cells. It is used to predict whether a chemical induces DNA damage or not. We expanded availability to the biomarker by developing the online TGx-28.65 biomarker application for predicting the DNA damage inducing (DDI) potential of suspect toxicants tested in p53-proficient human cells and assessing putative mode(s) of action (MOA). Applications like this that analyse gene expression data to predict the hazard potential of test chemicals hold great promise for risk assessment paradigms. The TGx-28.65 biomarker interfaces with an analytical tool to predict the probability that a test chemical can directly or indirectly induce DNA damage. User submitted in vitro microarray data are compared to the 28-chemical x 65-gene signature profile and the probability that the data fit the profile for a DDI or a non-DDI (NDDI) chemical is calculated. The results are displayed in the Results Table, which includes the classification probability and hyperlinks to view heatmaps, hierarchical clustering, and principal component analyses of user-input data in the context of the reference profile. The heatmaps and cluster plots, along with the corresponding text data files of fold changes in gene expression and Euclidean distances can be downloaded. Review of the test chemical data in relationship to the biomarker allows rapid identification of key gene alterations associated with DNA damage as well as chemicals in the reference set that produced a similar response.
Figures
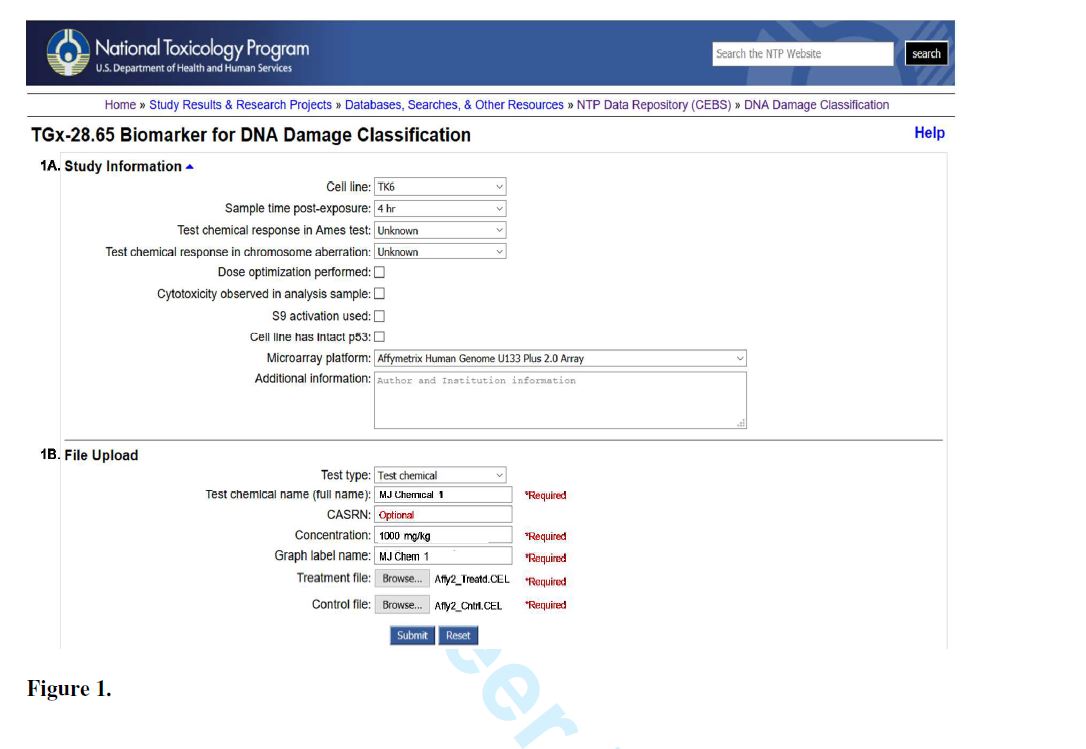
Figure 1. User interface for entering study information and information.
User interface for entering study information (1A) and information for the data files being uploaded (1B). Information for an example test chemical, MJ Chemical 1, tested in TK6 cells at 1000 mg/kg for 4 hours are displayed. The Affymetrix Human Genome U133 Plus 2.0 Array is shown as the microarray platform used.
- Figure 1 (85 KB)
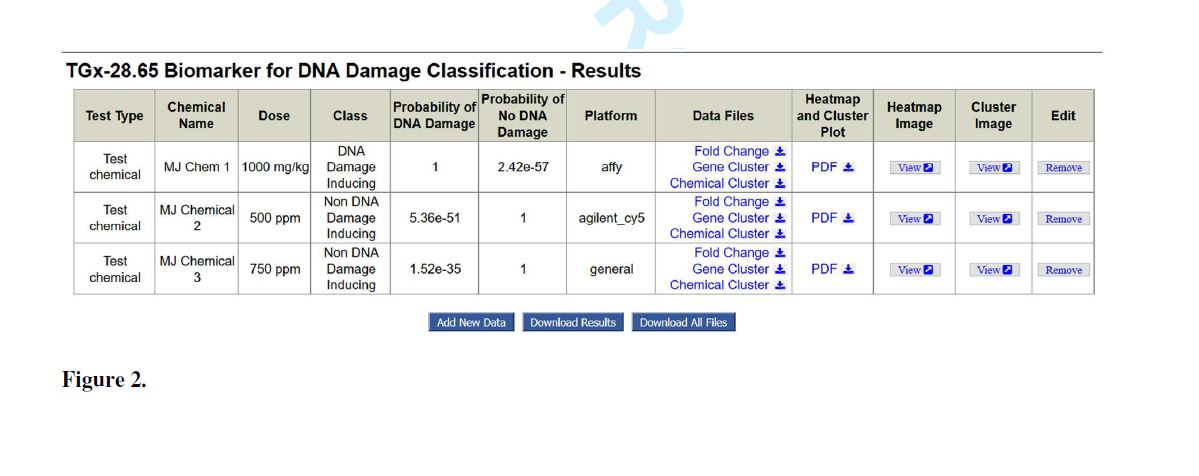
Figure 2. Summary table showing results from analysis of data for three example test chemicals.
Summary table showing results from analysis of data for three example test chemicals.
- Figure 2 (73 KB)
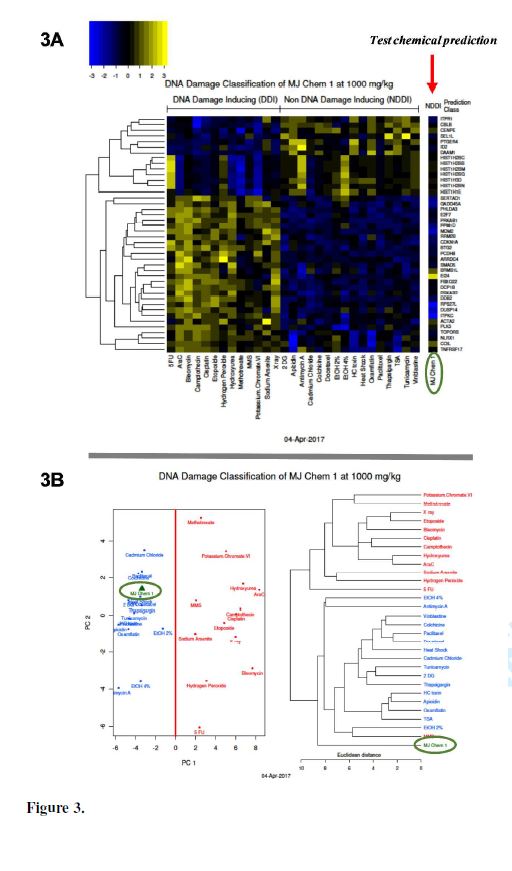
Figure 3. Heatmap and cluster plot of results from analysis of example test chemical MJ Chemical 1.
Heatmap and cluster plot of results from analysis of example test chemical MJ Chemical 1. Test chemical data are labeled “MJ Chem 1” as shown inside the green ovals.
- Figure 3 (65 KB)
Tables
Table 1. Euclidean distance values from a sample portion.
Euclidean distance values from a sample portion of a Gene Cluster data file for MJ Chem 1.
- Table 1 (70 KB)