

Lung Deposition and Clearance of Microparticle and Nanoparticle C60 Fullerene Aggregates in B6C3F1 Mice and Wistar Han Rats Following Nose-Only Inhalation for 13 Weeks
Sayers BC, Walker NJ, Roycroft JH, Germolec DR, Baker GL, Clark ML, Hayden BK, DeFord H, Dill JA, Gupta A, Stout MD.
Toxicology (2016).
DOI: https://doi.org/10.1016/j.tox.2015.11.003
PMID: 26612504
Publication
Abstract
C60 fullerenes (C60) are spherical structures consisting of 60 carbon atoms that are generated via combustion from both natural and anthropogenic sources. C60 are also synthesized intentionally for industrial applications. Individual C60 structures have an approximate diameter of 1 nm; however, C60 readily forms aggregates and typically exist as larger particles that range from nanometers to micrometers in diameter. In this report, lung and extrapulmonary tissue deposition and lung clearance of C60 nanoparticles (nano-C60, 50 nm) and microparticles (micro-C60, 1 μm) were examined in Wistar Han rats and B6C3F1/N mice after nose-only inhalation for 90 days. Exposure concentrations were 0.5 and 2 mg/m3 (nano-C60) and 2, 15, and 30 mg/m3 (micro-C60). For both C60 particle sizes, the C60 lung burden increased proportionally to exposure concentration. The C60 lung burden was greater in both species at all time points following exposure to nano-C60 particle exposure compared to micro-C60 exposure at the common exposure concentration 2 mg/m3. The calculated C60 particle lung retention half-times were similar for both nano-C60 and micro-C60 exposure at 2 mg/m3 in male mice (15-16 days). In contrast, in male rats, the half-time of C60 particles following nano-C60 exposure (61 days) was roughly twice as long as the half-time following micro-C60 exposure (27 days) at the same exposure concentration (2 mg/m3) and was similar to the clearance following micro-C60 exposure at higher exposure concentrations (15 and 30 mg/m3). C60 was detected in bronchial lymph nodes but the burden was not quantified due to the high variability in the data. C60 concentrations were below the experimental limit of quantitation (ELOQ) in liver, spleen, blood, brain and kidney tissues. These tissue burden data provide information for comparison between nanometer and micrometer sized C60 particle exposure and will aid in the interpretation of toxicity data.
Figures
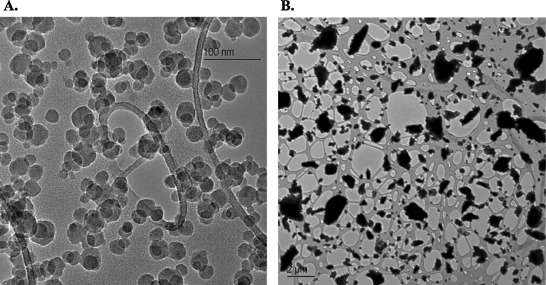
Figure 1. Representative TEM images of C60 fullerene particles.
Representative TEM images of C60 fullerene particles sampled from the nose port of the exposure carousel. (A) 50 nanometer-sized C60 (nano-C60); (B) 1 micrometer-sized C60 (micro-C60).
- Figure 1 (99 KB)
Tables
Table 1. Micro-C60 fullerene particle exposure data.
a
Determined as described in Section 2. Data presented as mean ± standard deviation.
b
Mass median aerodynamic diameter (MMAD) and geometric standard deviation (GSD) data presented as average values from monthly measurements.
- Table 1 (17 KB)
Table 2. Nano-C60 fullerene particle exposure data.
a
Determined as described in Section 2. Data presented as mean ± standard deviation.
b
Count median diameter (CMD) and geometric standard deviation (GSD) data presented as average values derived from scanning mobility particle sizer results.
c
Mass median aerodynamic diameter (MMAD) calculated from CMD and GSD using Hatch–Choate relationships assuming log-normal aerosol size distribution then converted to MMAD assuming a particle density of 1.72 g/cm3.
- Table 2 (17 KB)
Table 3. C60 Fullerene particle surface area calculations.
RAM—real-time aerosol monitor; ds—average surface area particle diameter; CMD—count median diameter; GSD—geometric standard deviation; MMD—mass median diameter; MMAD—mass median aerodynamic diameter; dm—average mass particle diameter.
- Table 3 (17 KB)
Table 4. C60 fullerene particle surface area exposure data.
a
Calculated as described in Section 2. Data presented as average value of rat and mouse exposure studies.
b
Calculated as (targeted exposure concentration)(average aerosol surface area to mass ratio)/1000.
- Table 4 (16 KB)
Table 5. Lung Burden in male Wistar Han rats following 13-week inhalation of C60.
a Data are presented as mean ± SD; N = 6 except as noted.
b Significantly different than controls at p ≤ 0.05.
c N = 5.
d ≤ELOQ = less than or equal to experimental limit of quantitation (ELOQ = 0.20 μg/g).
e Significantly different than 0.5 mg/m3 at p ≤ 0.05.
f Significantly different than 2 and 15 mg/m3 at p ≤ 0.05.
- Table 5 (19 KB)
Table 6. Lung burden in male B6C3F1/N mice following 13-week inhalation of C60.
a Data are presented as mean ± SD; N = 6 except as noted.
b Significantly different than controls at p ≤ 0.05.
c N = 5.
d ≤ELOQ = Less than or equal to experimental limit of quantitation (ELOQ = 0.34 μg/g).
e Significantly different than 0.5 mg/m3 at p ≤ 0.05.
f Significantly different than 2 and 30 mg/m3 at p ≤ 0.05.
g Significantly different than 2 and 15 mg/m3 at p ≤ 0.05.
- Table 6 (19 KB)
Table 7. Lung deposition and clearance parameters in male rats and mice.
Key: Ao = lung burden at t = 0 days postexposure; k = first-order clearance rate constant in days−1; t1⁄2 = retention half-time in days.
- Table 7 (11 KB)
Table 8. Lung burden in female Wistar Han rats and B6C3F1/N mice following 13-week inhalation of C60
a Data are presented as mean ± SD; N = 8 except as noted.
b N = 7.
c ≤ELOQ = less than or equal to experimental limit of quantitation (ELOQ = 0.20 μg/g (rats); 0.34 μg/g (mice)).
d ≥ELOQ = greater or equal to experimental limit of quantitation (ELOQ = 0.20 μg/g; average study sample result = 0.26 μg/g).
e Significantly different than controls at p ≤ 0.05.
f Significantly different than 2 and 30 mg/m3 at p ≤ 0.05.
g Significantly different than 2 and 15 mg/m3 at p ≤ 0.05.
- Table 8 (12 KB)
Table 9. C60 estimated surface area per lung in Wistar Han rats and B6C3F1/N mice.
a Estimated surface area per lung (cm2/lung) calculated as (average aerosol surface area to mass ratio [from Table 4]) (Lung Burden [from Tables 5–7])/100 to convert m2–cm2.
For male animals, lung burden values at post exposure Day 0 were used to calculate surface area per lung.
- Table 9 (17 KB)
Supplemental Materials
Supplemental Data
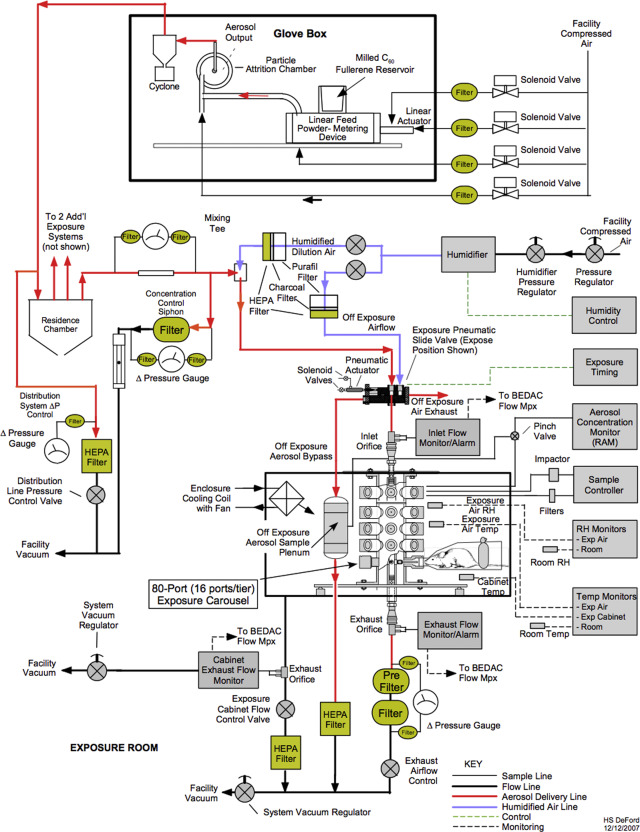
Figure S1. Schematic diagram of the nose-only exposure system used for micro-C60 particle exposures.
Figure S2. Schematic diagram of the nose-only exposure system used for nano-C60 particle exposures.
Figure S3. Graphical comparison of first order model fit and lung burden data following micro-C60 exposure.
Figure S4. Graphical comparison of first order model fit and lung burden data following nano-C60 exposure.