

Mouse Population-Based Evaluation of Urinary Protein and miRna Biomarker Performance Associated with Cisplatin Renal Injury
Alison H Harrill, Haixia Lin, Julia Tobacyk, John C Seely
Experimental Biology and Medicine (2017).
DOI: https://doi.org/10.1177/1535370217740854
PMID: 29110506
Publication
Abstract
Discovery and qualification of novel biomarkers with improved specificity and sensitivity for detection of xenobiotic-induced injuries is an area of active research across multiple sectors. However, the majority of efforts in this arena have used genetically limited rodent stocks that lack variability in xenobiotic responses inherent to genetically heterogeneous human populations. In this study, genetically diverse Diversity Outbred (DO) mice were used as a surrogate for human clinical populations to investigate performance of urinary kidney biomarkers against classical preclinical kidney injury biomarkers (blood urea nitrogen [BUN] and serum creatinine). In this study, cisplatin was used as a paradigm kidney toxicant, with female adult DO mice exposed to a single injection (5 mg/kg) of cisplatin or vehicle and necropsied 72 h post-exposure and 18 h following overnight urine collection. Interindividual variability in kidney toxicity was observed, with DO mice experiencing either no tubule cell necrosis or minimal-mild necrosis. A panel of urinary protein biomarkers and profiled miRNAs were assessed by receiver-operating characteristic curves as to their ability to distinguish non-responder versus responder animals, as defined by histopathological evidence of renal tubule cell necrosis. A surprising outcome of these studies was that BUN was elevated alongside of urinary miRNA and protein biomarkers in animals with grade 2 proximal tubular cell necrosis; but not elevated with grade 1 necrosis. These studies demonstrate a novel approach for using a rodent population to better assess sensitivity of candidate biomarkers, especially for proposed clinical applications.
Figures
Figure 1. Conventional kidney injury biomarkers in DO mice.
Concentrations of (a) BUN and (b) sCre are shown. Dots represent values for individual animals within each treatment group. Bars represent the mean ± SD. *p < 0.05. BUN: blood urea nitrogen.
- Figure 1 (139 KB)
Figure 2. Differential susceptibility to cisplatin-induced kidney tubule necrosis.
Representative photomicrographs are shown for H&E-stained kidney tissue derived from vehicle-treated (a) and cisplatin-treated (b–d) DO mice. Severity grade of renal tubule necrosis is indicated by the color bars. Panels a and b demonstrate no tubule injury, panel c demonstrates minimal tubule necrosis (grade 1), and panel d demonstrates mild renal tubule necrosis (grade 2). Magnification is at 400X. (A color version of this figure is available in the online journal.)
- Figure 2 (2 MB)
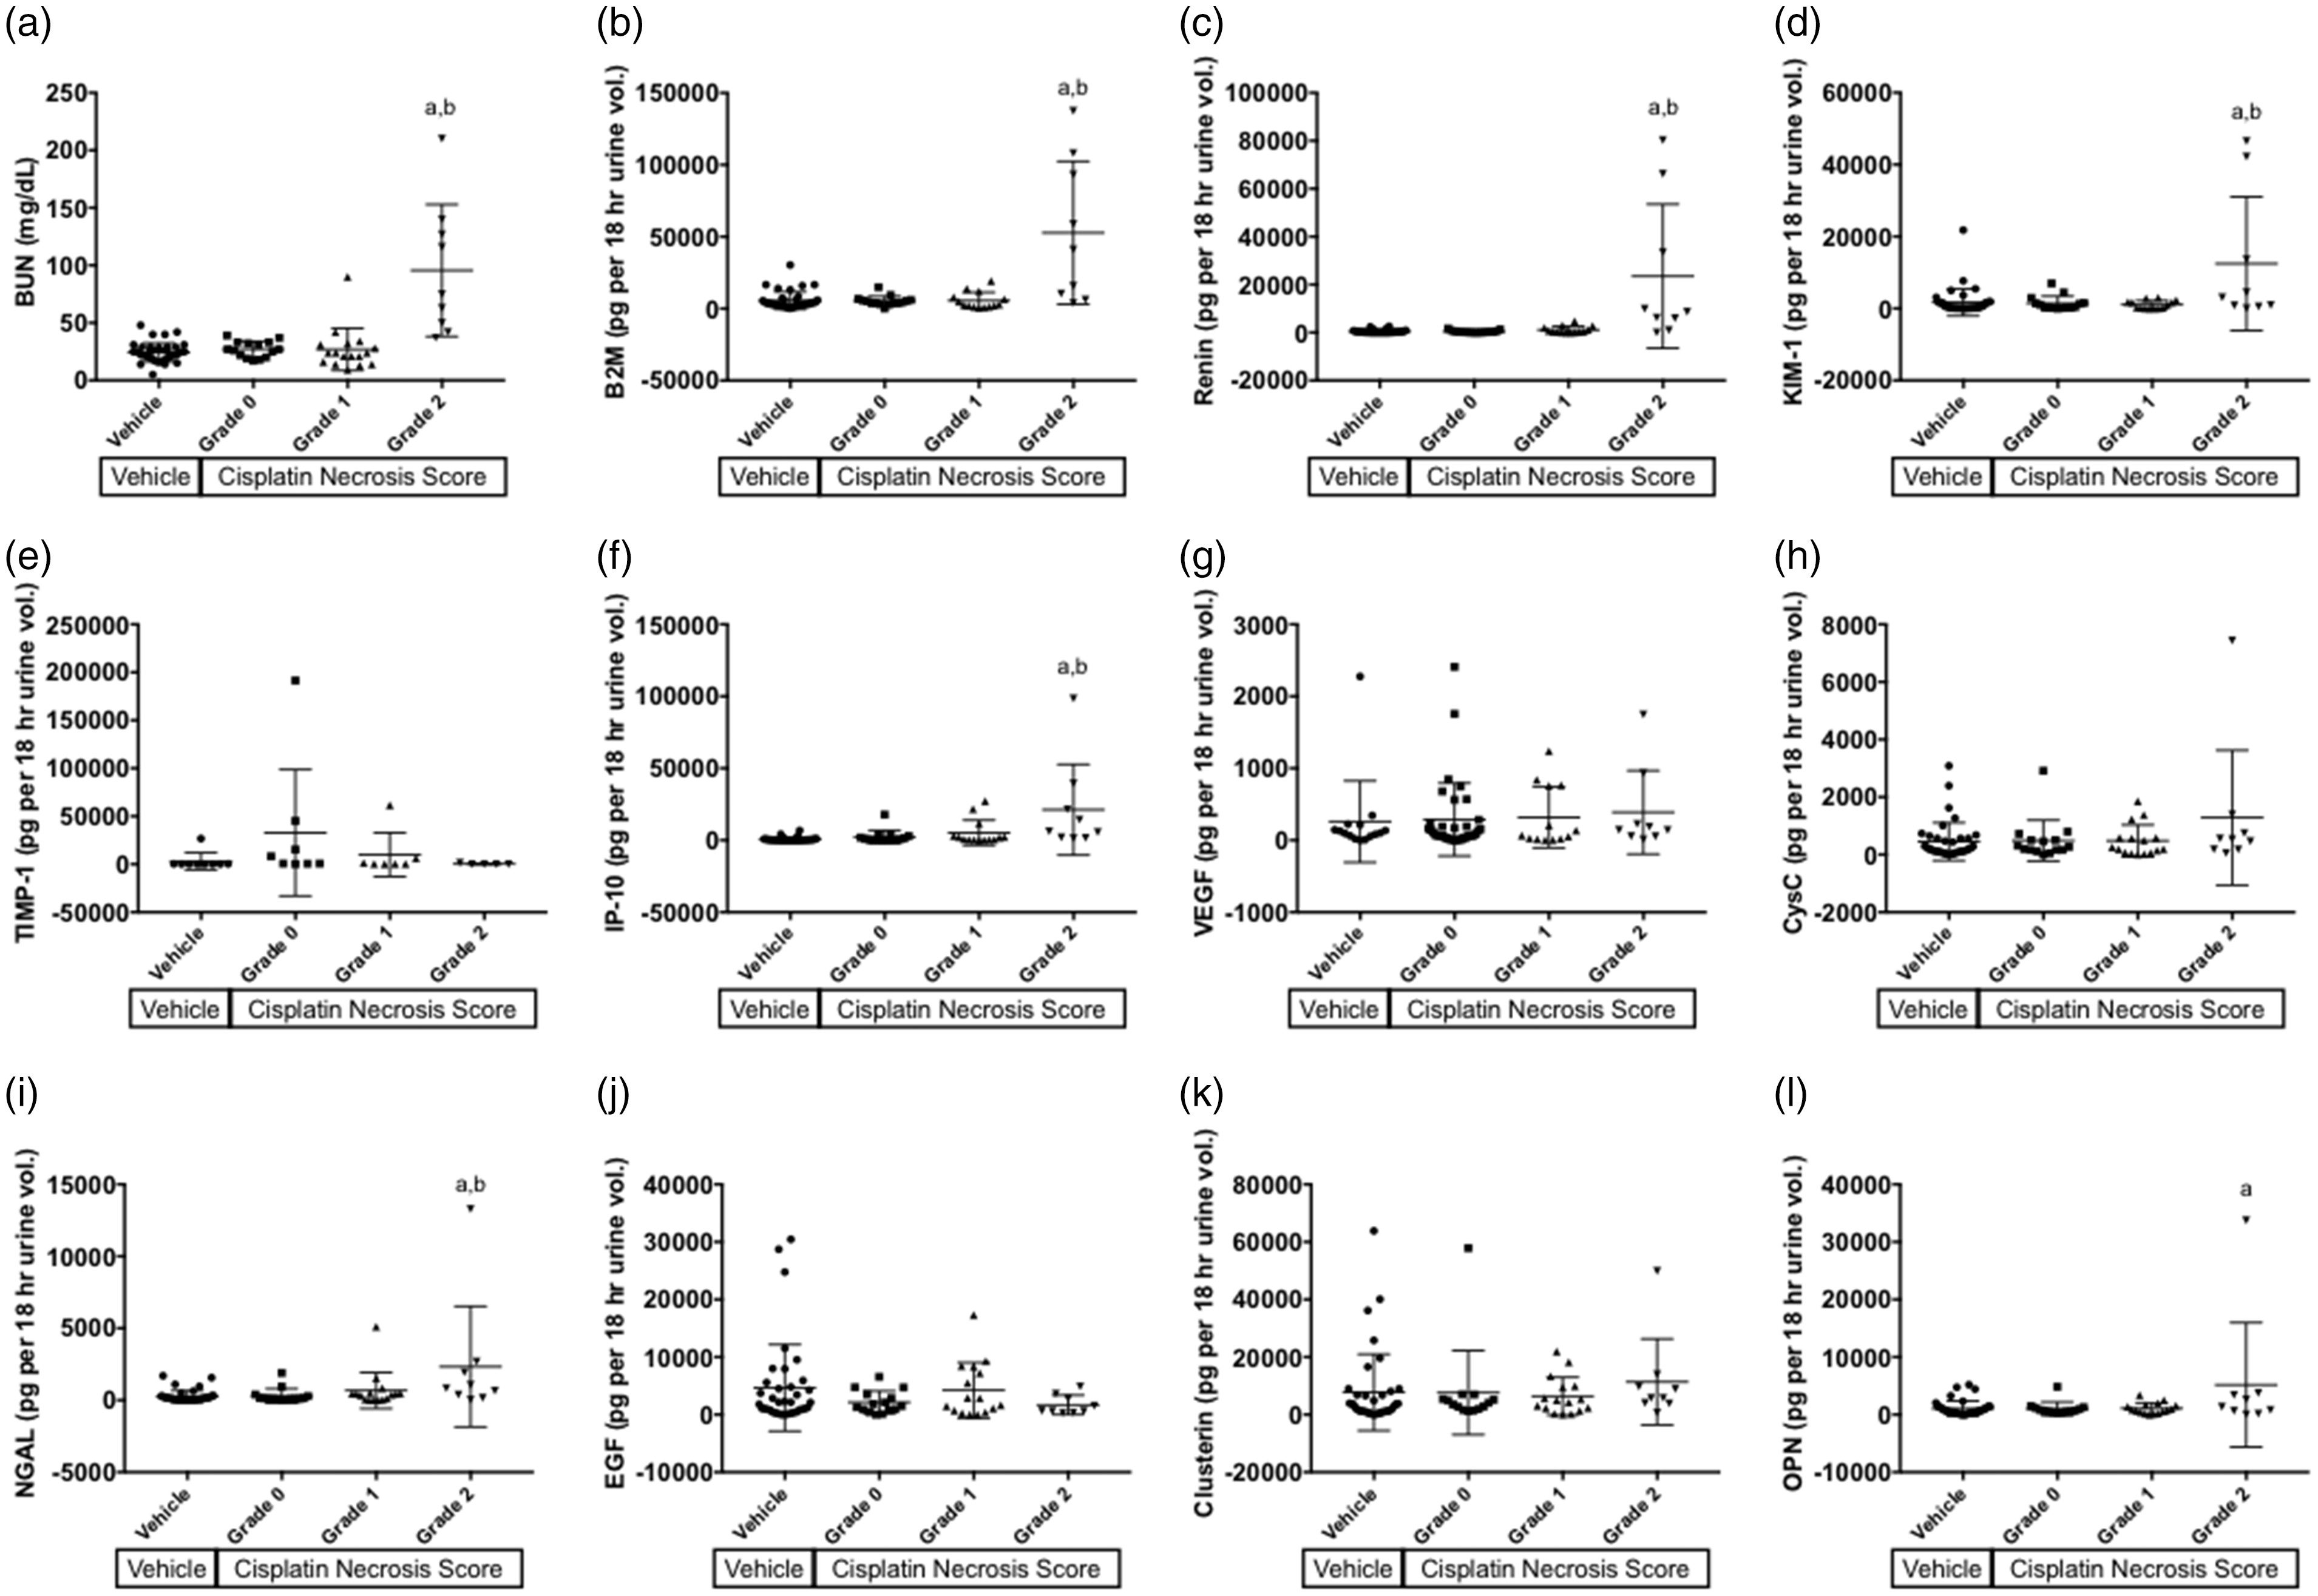
Figure 3. BUN and urinary protein biomarkers separated by necrosis score.
(a) Concentrations of BUN are shown for DO mice and are separated by severity score for renal tubule necrosis. Similarly, abundance of urinary proteins normalized to urine volume collected over 18 h is shown in (b–l). Analytes shown include (b) B2M, (c) renin, (d) KIM-1, (e) TIMP-1, (f) IP-10, (g) VEGF, (h) cystatin C, (i) NGAL, (j) EGF, (k) clusterin, and (l) OPN. Bars indicate ± SD. a: p < 0.05 for group comparison of cisplatin grade 2 and vehicle control, b: p < 0.05 for group comparison of cisplatin grade 2 and cisplatin grade 0.
BUN: blood urea nitrogen; B2M: β2-microglubulin; EGF: epidermal growth factor; IP-10: interferon gamma-induced protein 10; KIM-1: kidney injury molecule-1, albumin; NGAL: neutrophil gelatinase-associated lipocalin; OPN: osteopontin; TIMP-1: TIMP metalloprotease inhibitor 1; VEGF: vascular endothelial growth factor.
- Figure 3 (556 KB)
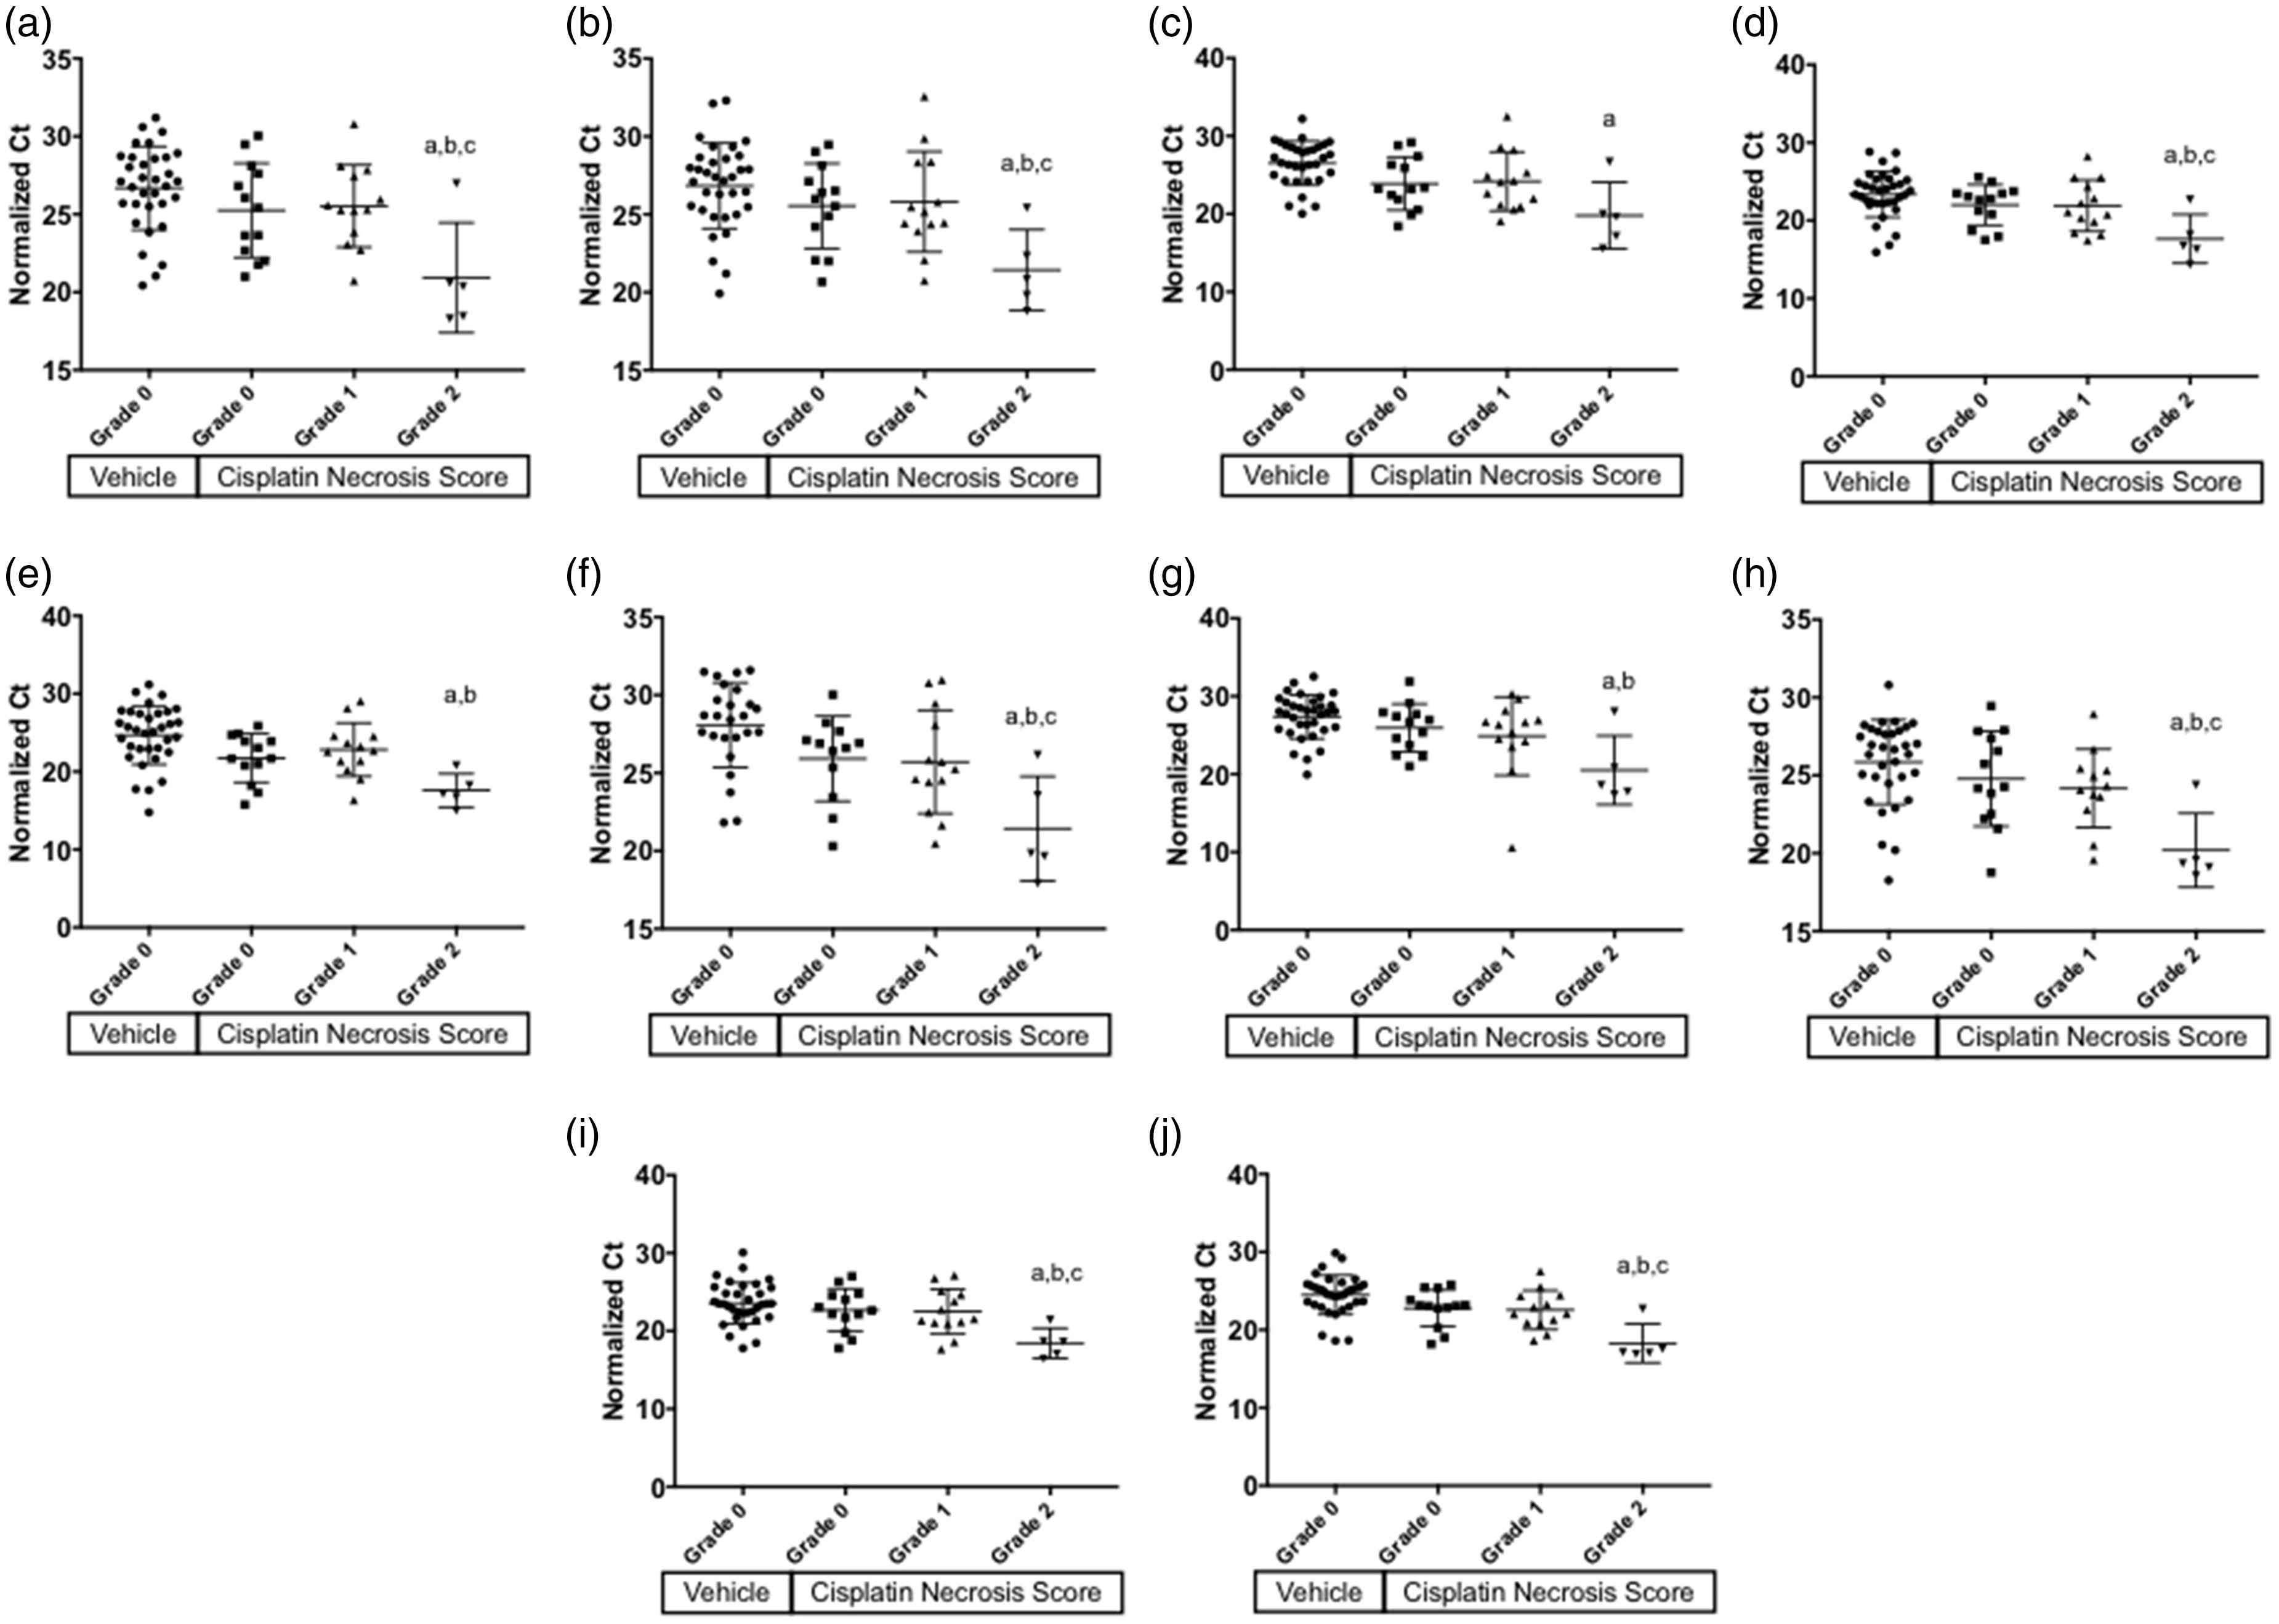
Figure 4. Relative urinary abundance of miRNA separated by necrosis score.
Normalized Ct values are shown for miRNA biomarker candidates identified by ANOVA analysis. Owing to the nature of Ct data, lower values indicate a higher abundance on a logarithmic scale. Ct values of urinary miRNA is shown for (a) miR-130a, (b) miR-151–3p, (c) miR-218, (d) miR-320, (e) miR-680, (f) miR-138, (g) miR-152, (h) miR-221, (i) miR-328, and (j) miR-685. Bars indicate mean ± SD. a: p < 0.05 for group comparison of cisplatin grade 2 and vehicle control, b: p < 0.05 for group comparison of cisplatin grade 2 and cisplatin grade 0, c: p < 0.05 for group comparison of cisplatin grade 2 and cisplatin grade 1. Ct: cycle threshold.
- Figure 4 (466 KB)
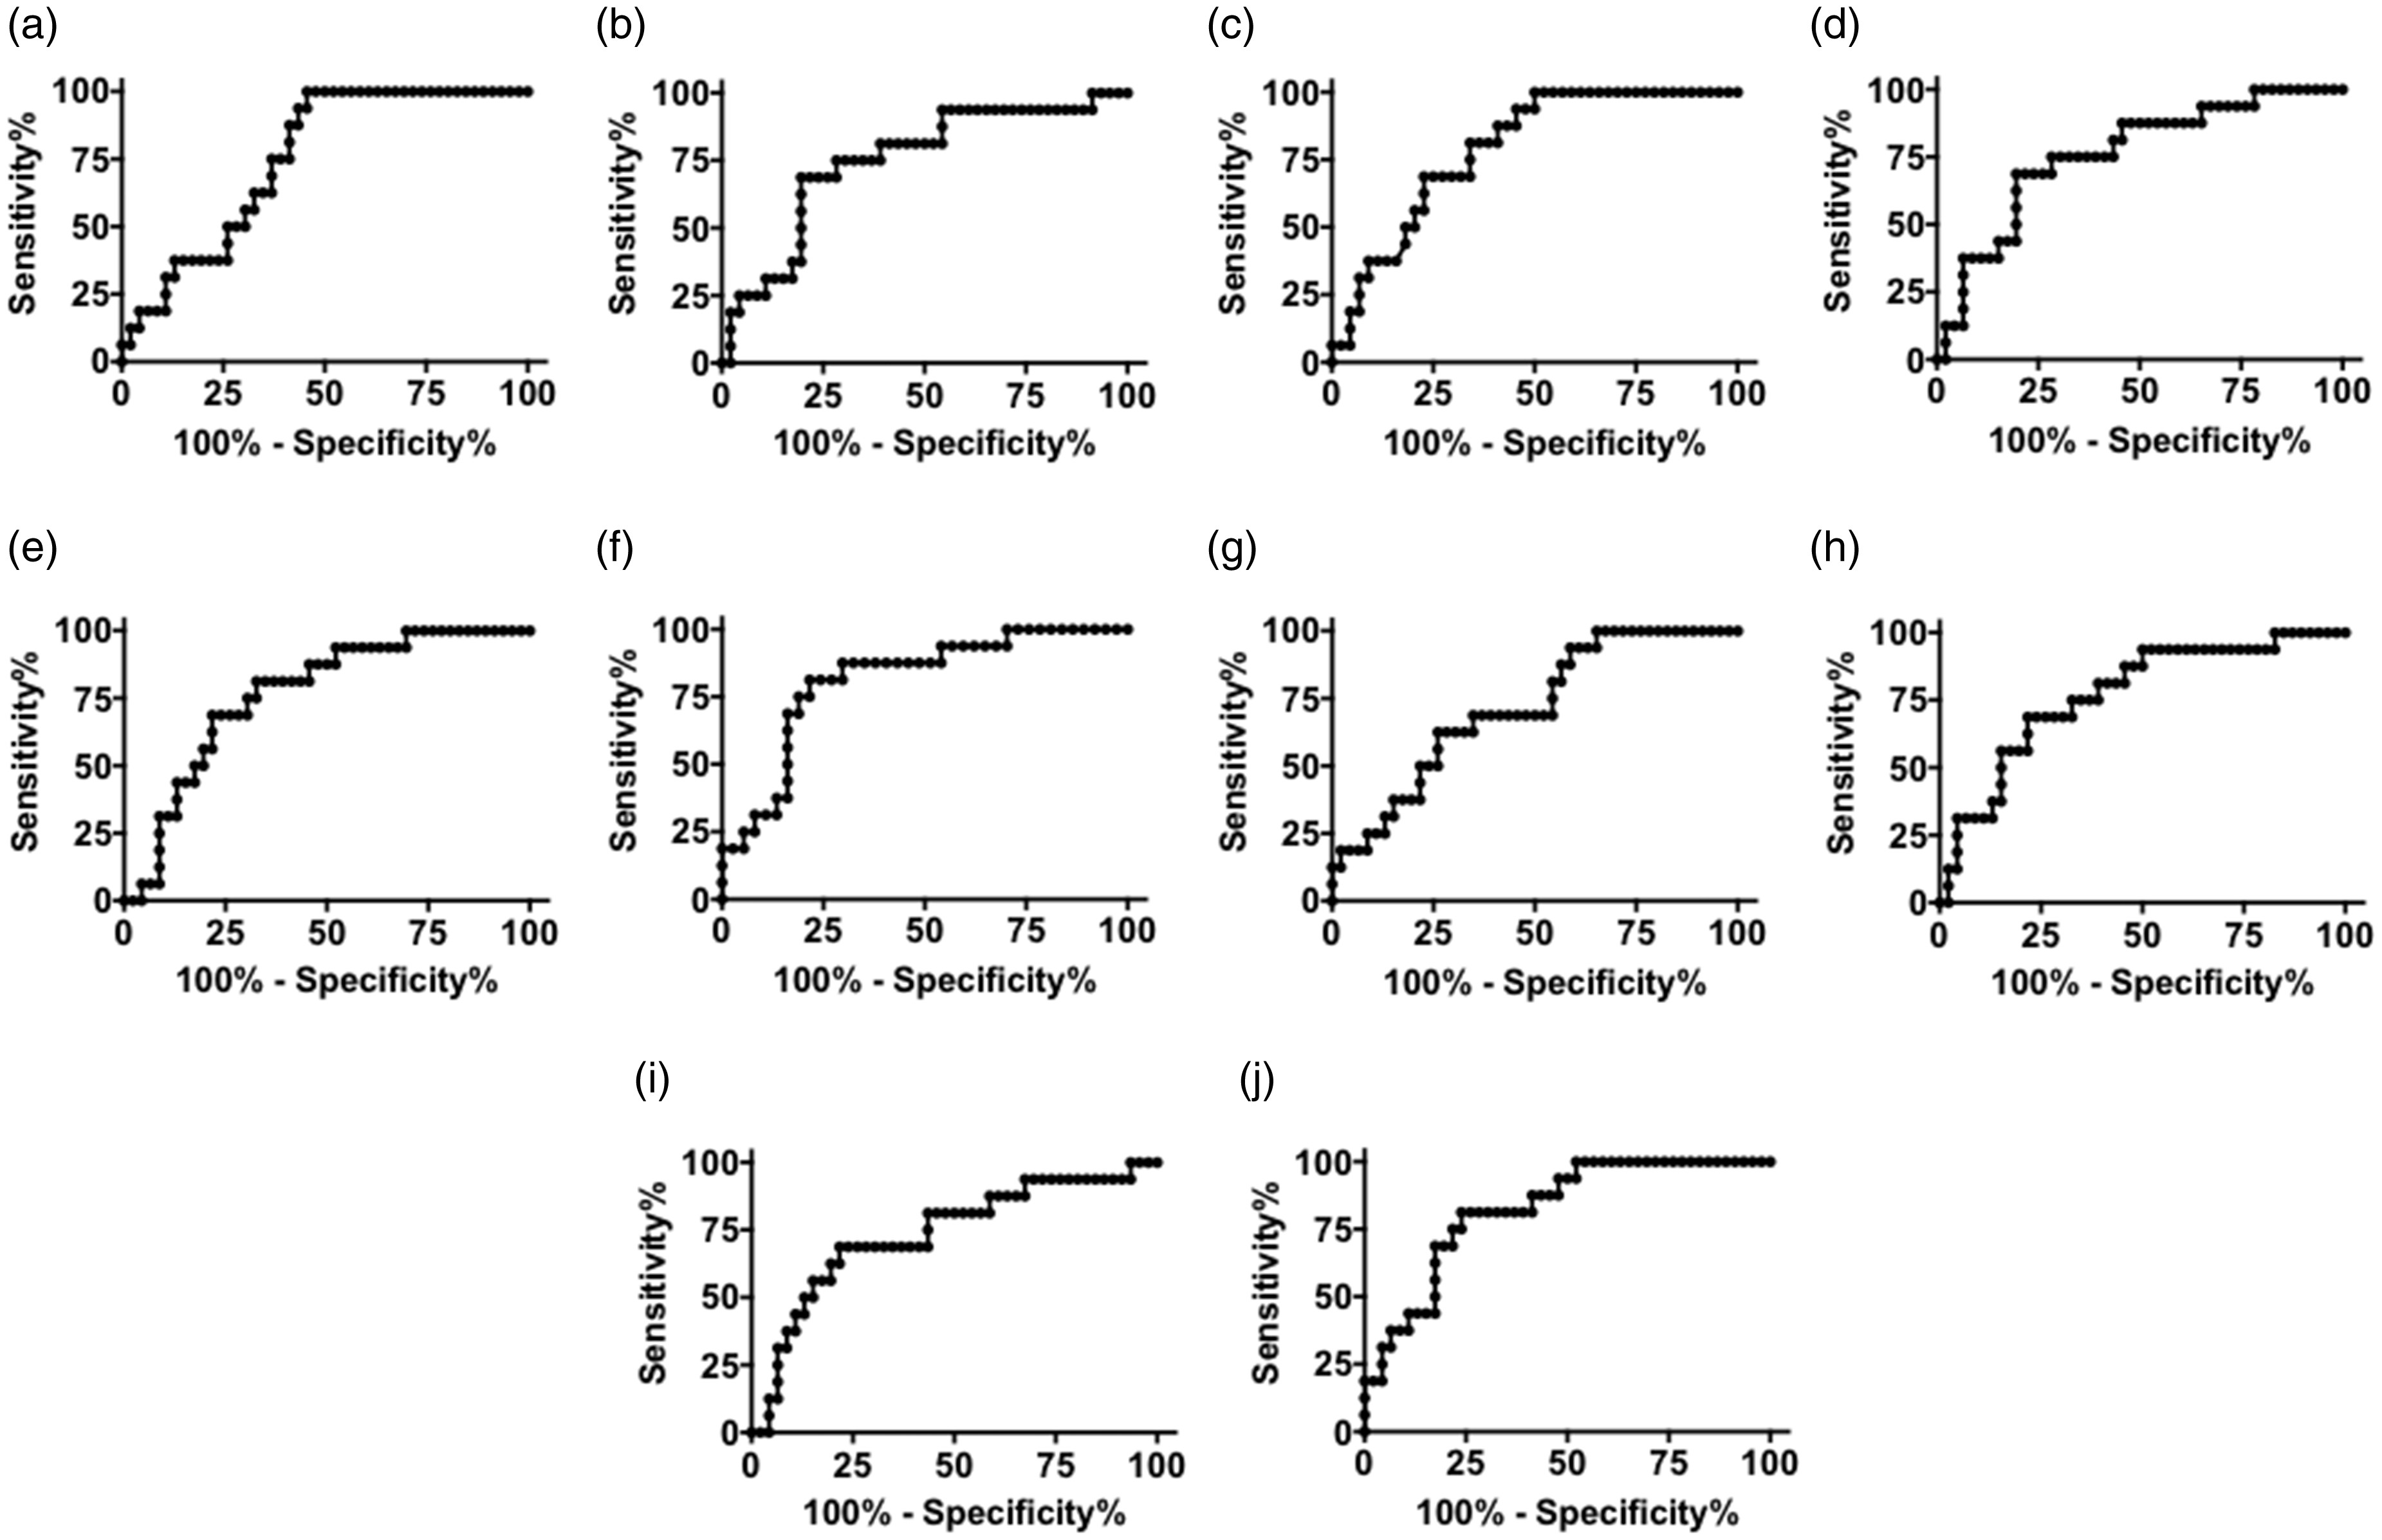
Figure 5. ROC curves are shown for candidate urinary miRNA biomarkers of renal tubule necrosis.
Comparative ROC curve analysis was performed to determine the ability of candidate miRNA biomarkers to predict histopathological kidney injury observed at time of necropsy in DO mice (grade 1 or 2 tubule necrosis). Significance was determined using the Mann–Whitney test. AUROC and ROC curve fit p values are indicated in Table 2. ROC curves of urinary miRNA are shown for (a) miR-130a, (b) miR-151-3p, (c) miR-218, (d) miR-320, (e) miR-680, (f) miR-138, (g) miR-152, (h) miR-221, (i) miR-328, and (j) miR-685. On the y-axis, sensitivity % indicates the true positive prediction rate while on the x-axis, 100%−specificity% indicates the false positive prediction rate. ROC: receiver-operating characteristic.
- Figure 5 (401 KB)
Tables
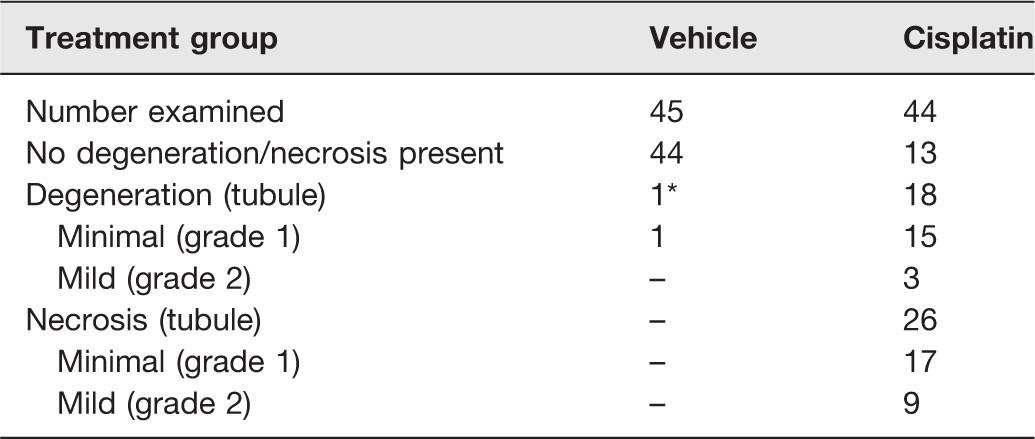
Table 1. Incidence of histopathological lesions in the kidney by degree of severity.
Incidence (numbers of animals) that sustained each lesion for a given severity grade is indicated in the table. N = 45 vehicle-treated mice and N = 44 cisplatin-treated mice.
*Indicates finding occurred in vehicle group and is unrelated to cisplatin exposure.
- Table 1 (78 KB)
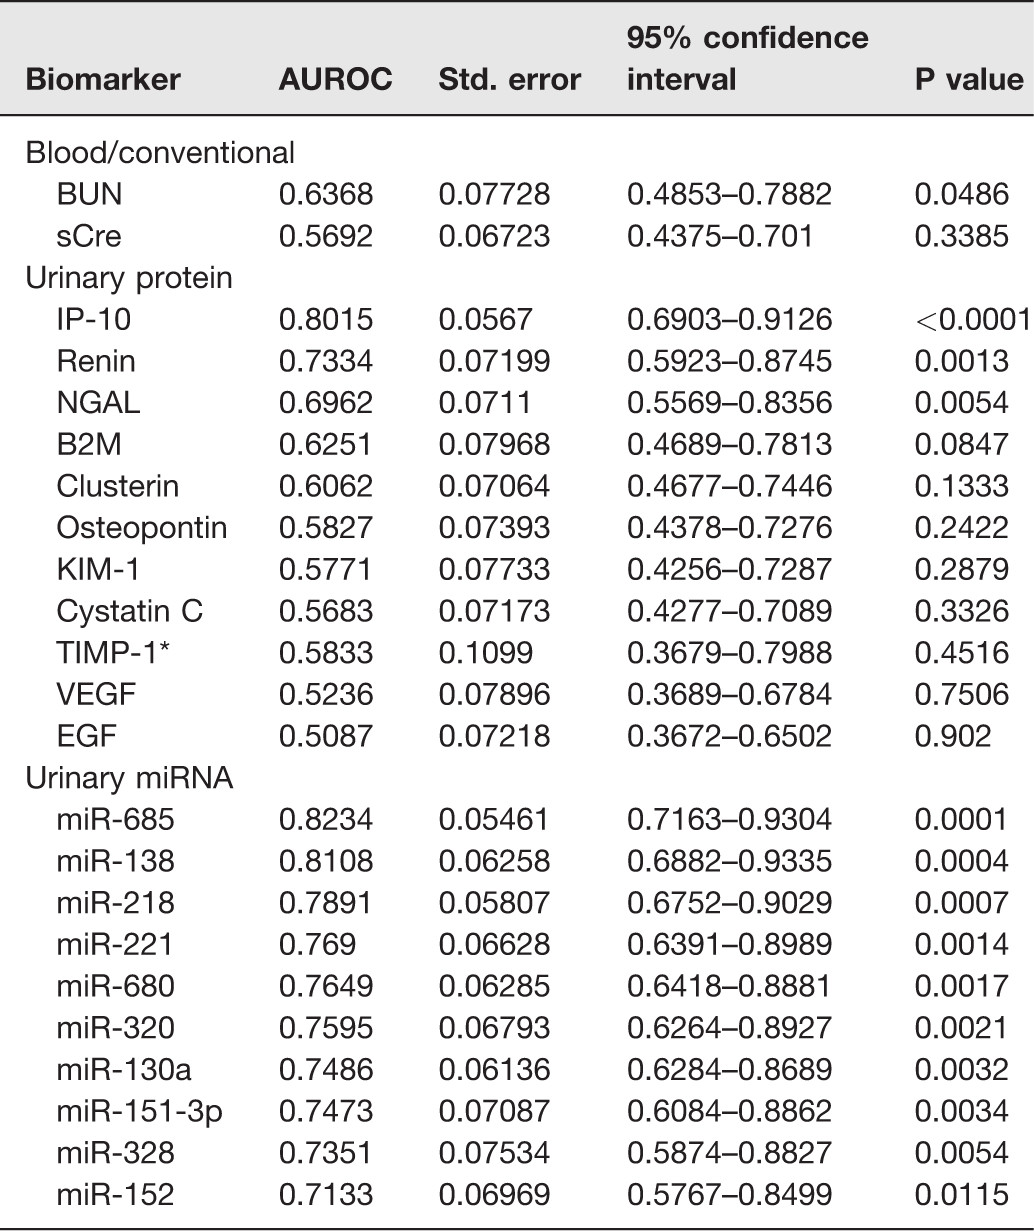
Table 2. ROC curve analysis of blood and urinary biomarkers.
AUROC: area under the ROC; BUN: blood urea nitrogen; B2M: β2-microglubulin; EGF: epidermal growth factor; IP-10: interferon gamma-induced protein 10; KIM-1: kidney injury molecule-1 (KIM-1), albumin; NGAL: neutrophil gelatinase-associated lipocalin; ROC: receiver-operating characteristic; TIMP-1: TIMP metalloprotease inhibitor 1; VEGF: vascular endothelial growth factor.
Within each biomarker category, markers are sorted by AUROC value from highest to lowest.
*Several values for TIMP-1 in both the vehicle- and cisplatin-treated mice were below the lower limit of quantification; therefore, these data should be interpreted with caution.
- Table 2 (307 KB)
Supplemental Materials
Supplemental Data
- Supplemental Table 1 (110 KB)
- Supplemental Table 2 (90 KB)