

Investigating the Generalizability of the MultiFlow® DNA Damage Assay and Several Companion Machine Learning Models with a Set of 103 Diverse Test Chemicals
Steven M Bryce, Derek T Bernacki, Stephanie L Smith-Roe, Kristine L Witt, Jeffrey C Bemis, and Stephen D Dertinger.
Toxicological Sciences (2017).
DOI: https://doi.org/10.1093/toxsci/kfx235
PMID: 29106658
Publication
Abstract
The in vitro MultiFlow DNA Damage assay multiplexes p53, γH2AX, phospho-histone H3, and polyploidization biomarkers into 1 flow cytometric analysis (Bryce, S. M., Bernacki, D. T., Bemis, J. C., and Dertinger, S. D. (2016). Genotoxic mode of action predictions from a multiplexed flow cytometric assay and a machine learning approach. Environ. Mol. Mutagen. 57, 171–189). The work reported herein evaluated the generalizability of the method, as well as several data analytics strategies, to a range of chemical classes not studied previously. TK6 cells were exposed to each of 103 diverse chemicals, 86 of which were supplied by the National Toxicology Program (NTP) and selected based upon responses in genetic damage assays conducted under the Tox21 program. Exposures occurred for 24 h over a range of concentrations, and cell aliquots were removed at 4 and 24 h for analysis. Multiplexed response data were evaluated using 3 machine learning models designed to predict genotoxic mode of action based on data from a training set of 85 previously studied chemicals. Of 54 chemicals with sufficient information to make an a priori call on genotoxic potential, the prediction models’ accuracies were 79.6% (random forest), 88.9% (logistic regression), and 90.7% (artificial neural network). A majority vote ensemble of the 3 models provided 92.6% accuracy. Forty-nine NTP chemicals were not adequately tested (maximum concentration did not approach assay’s cytotoxicity limit) and/or had insufficient conventional genotoxicity data to allow their genotoxic potential to be defined. For these chemicals MultiFlow data will be useful in future research and hypothesis testing. Collectively, the results suggest the MultiFlow assay and associated data analysis strategies are broadly generalizable, demonstrating high predictability when applied to new chemicals and classes of compounds.
Figures
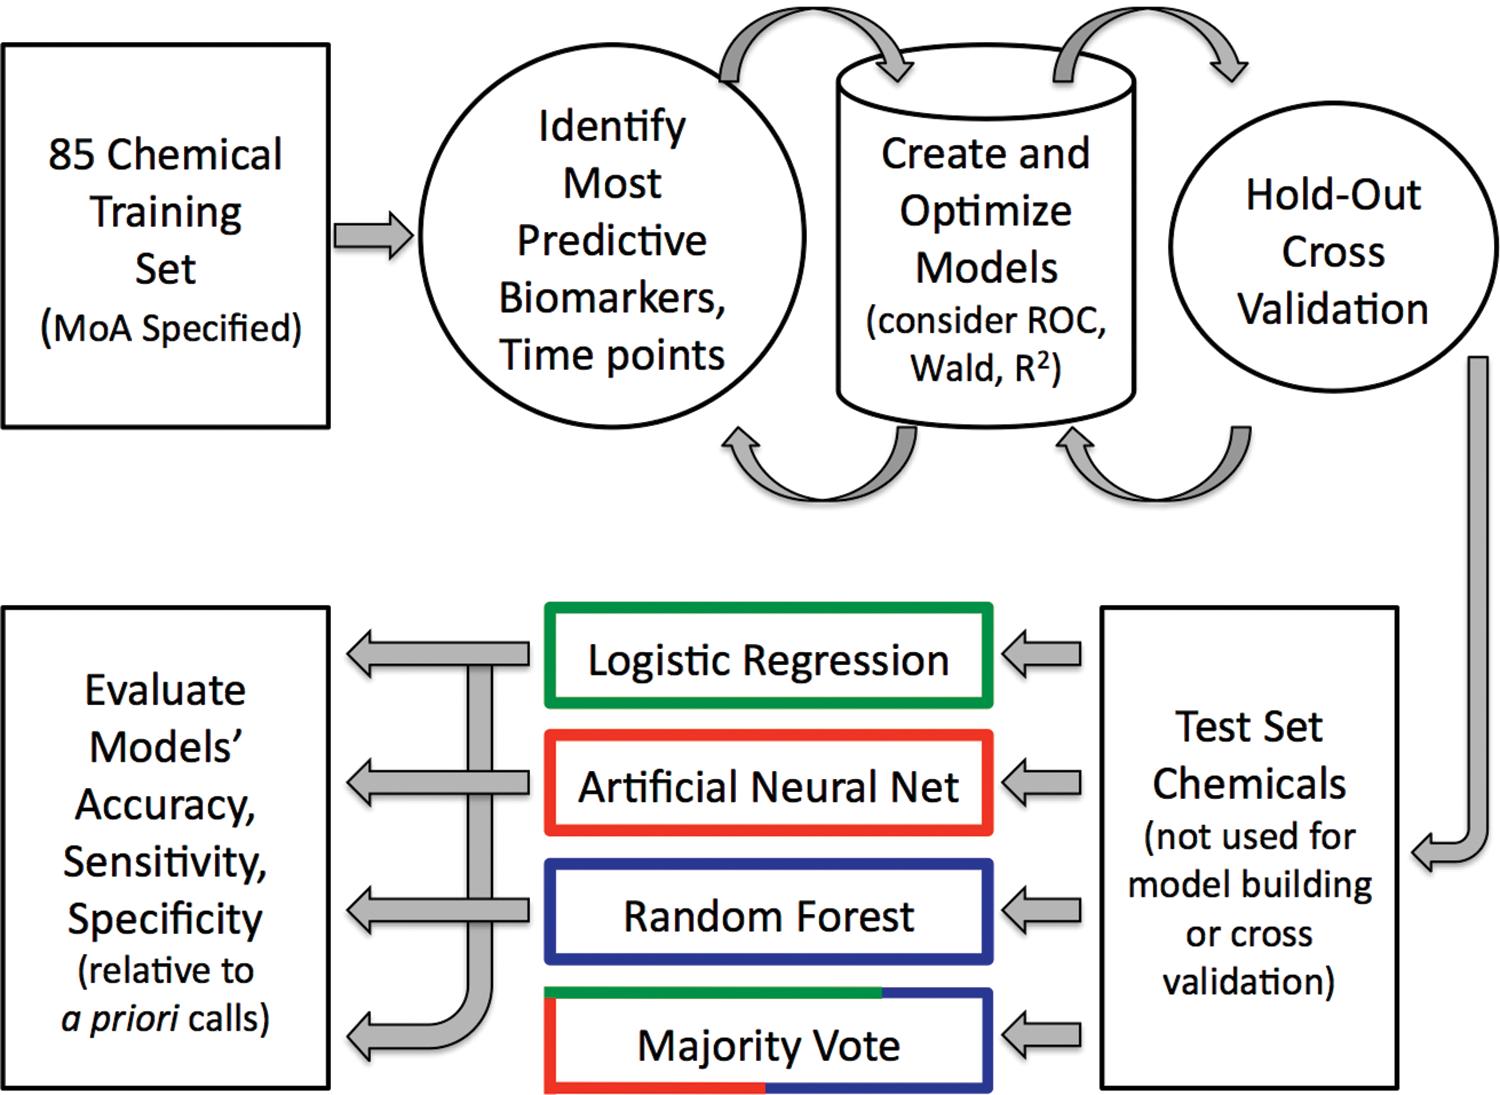
Figure 1. Overview of the several machine learning approaches.
Overview of the several machine learning approaches used to synthesize MultiFlow assay biomarker response data into in vitro mammalian cell genotoxic activity predictions.
- Figure 1 (630 KB)
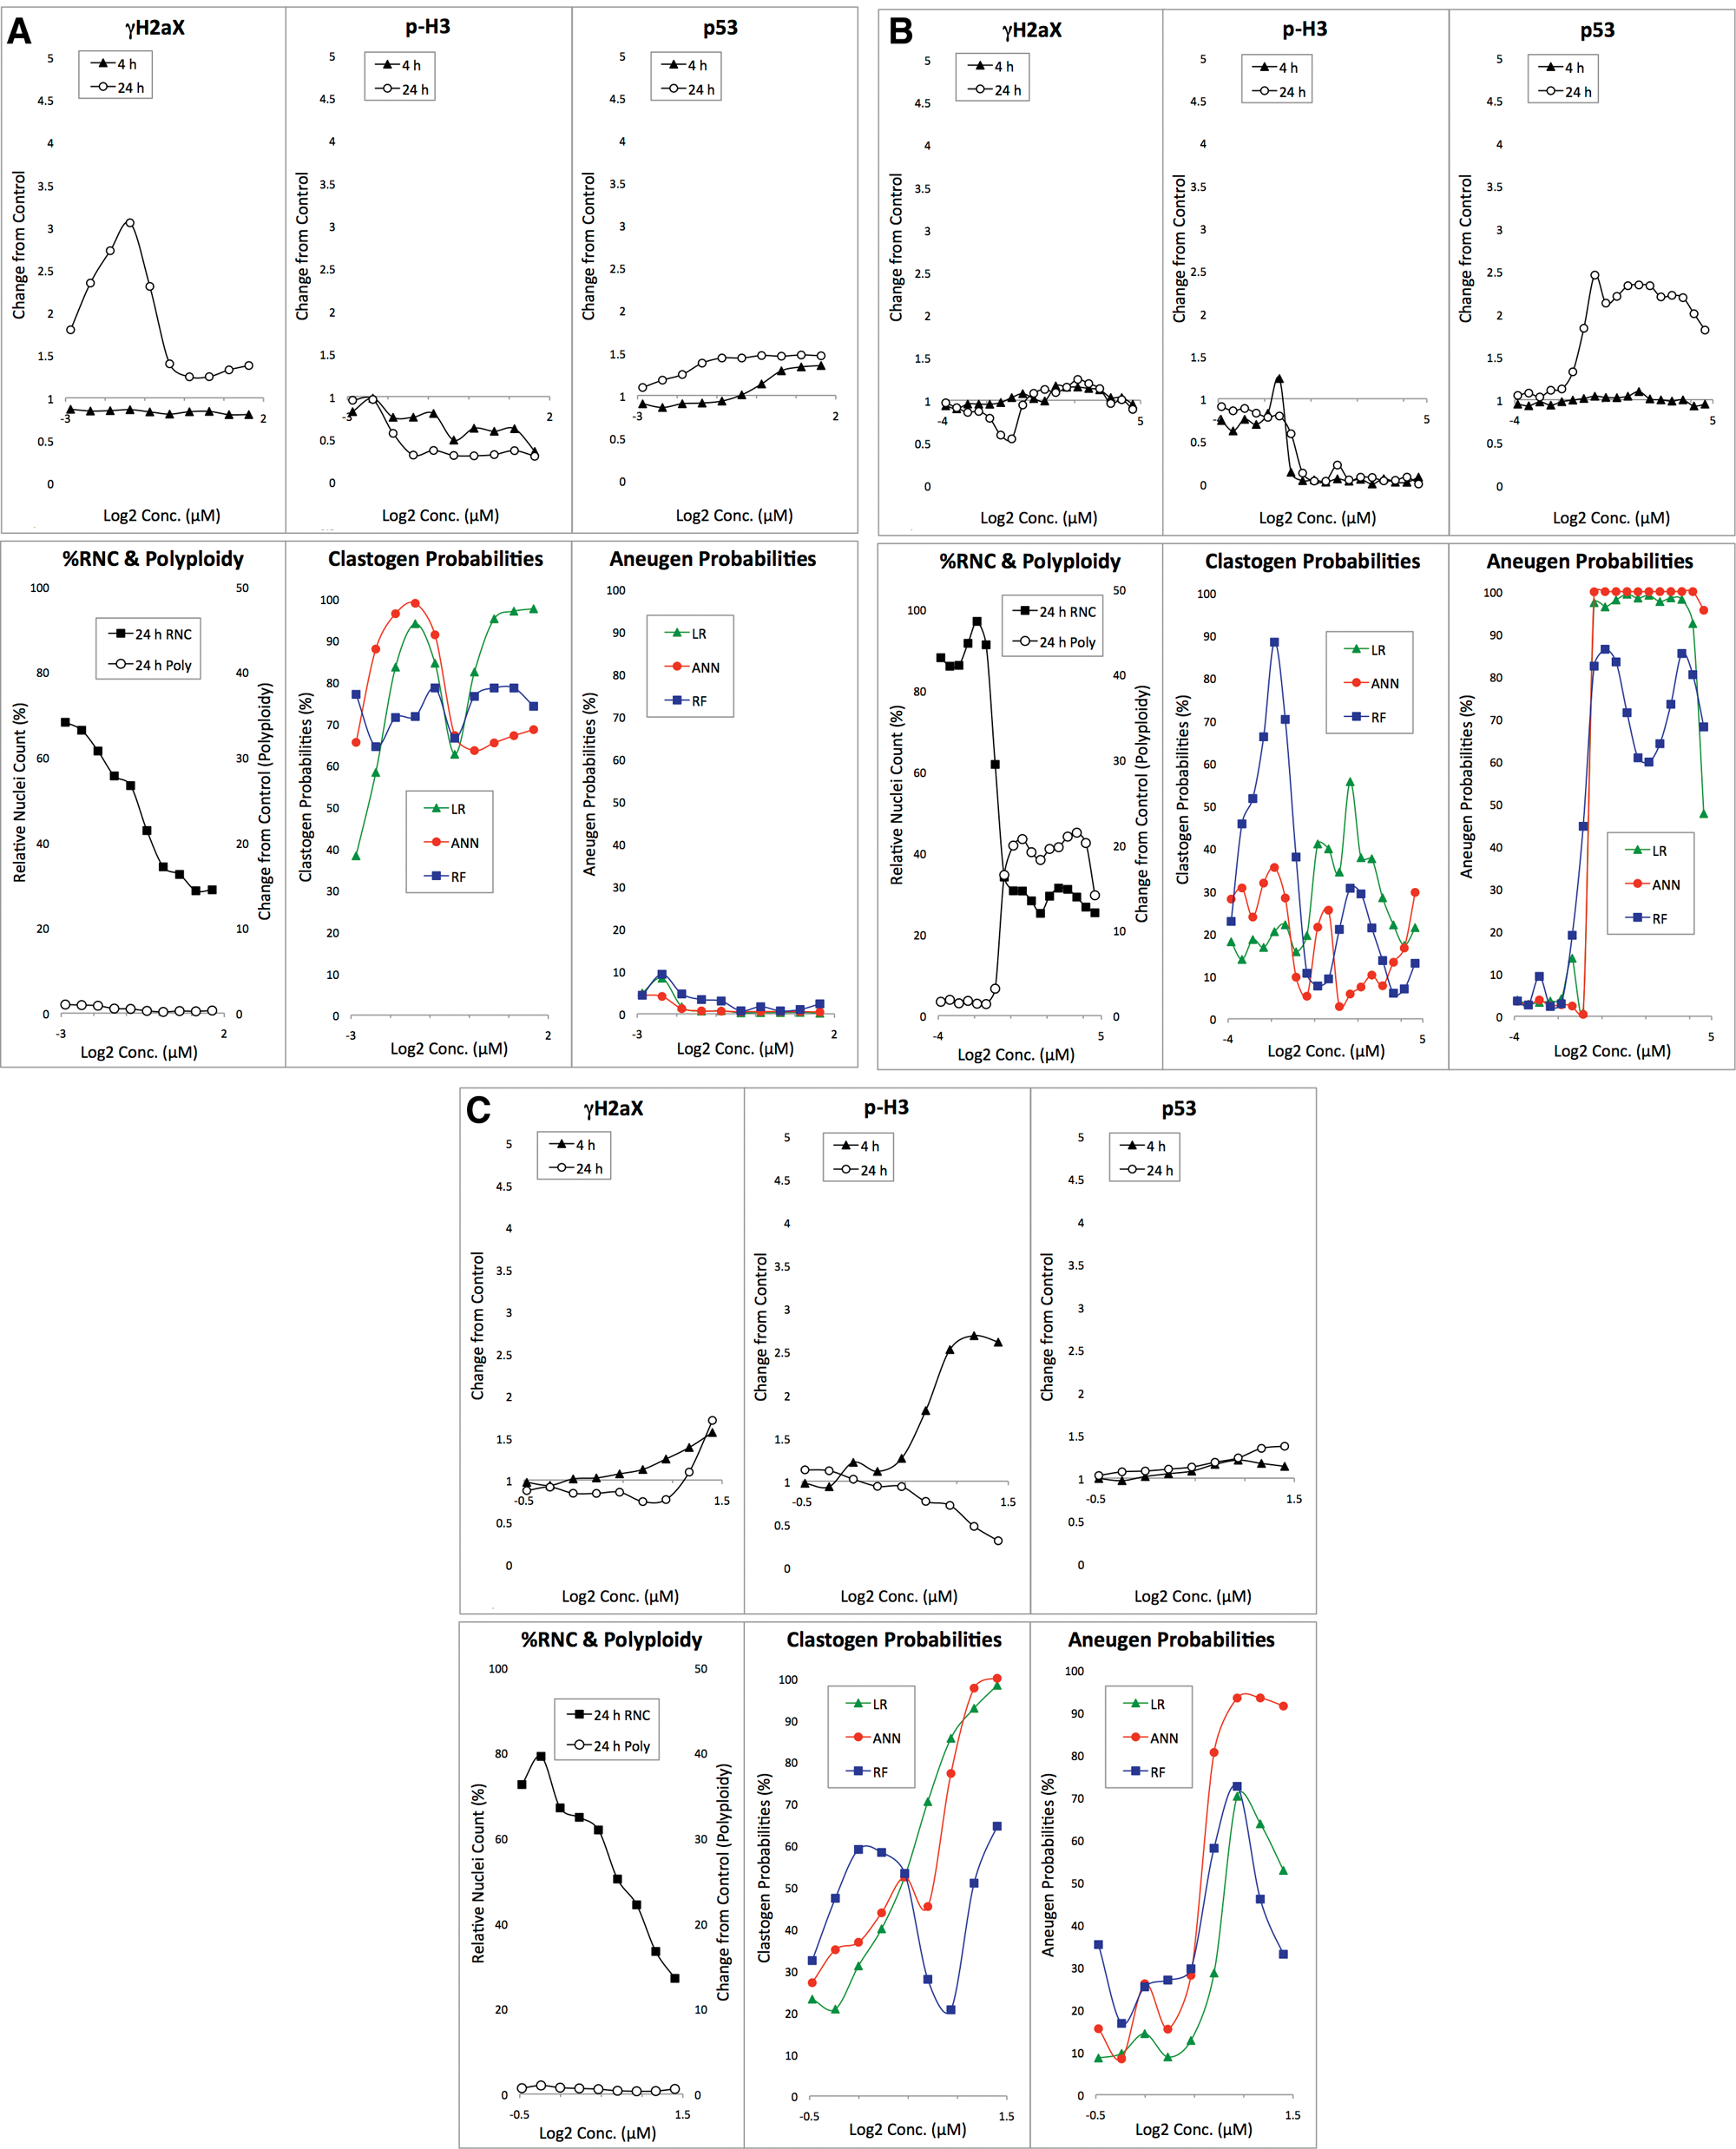
Figure 2. Biomarker response data.
A, Biomarker response data are graphed for anisomycin-exposed TK6 cells versus concentration. The bottom middle panel shows clastogen probabilities as a function of anisomycin concentration based on 3 machine learning algorithms: LR, ANN, and RF. The bottom right panel shows analogous aneugen probability scores.
B, Biomarker response data are graphed for adriamycin HCl-exposed TK6 cells versus concentration. The bottom middle panel shows clastogen probabilities as a function of adriamycin concentration based on 3 machine learning algorithms: LR, ANN, and RF. The bottom right panel shows analogous aneugen probability scores.
C, Biomarker response data are graphed for 2,2’, 5,5’-tetrachlorobenzidine-exposed TK6 cells versus concentration. The bottom middle panel shows clastogen probabilities as a function of 2,2’, 5,5’-tetrachlorobenzidine concentration based on 3 machine learning algorithms: LR, ANN, and RF. The bottom right panel shows analogous aneugen probability scores.
- Figure 2 (816 KB)
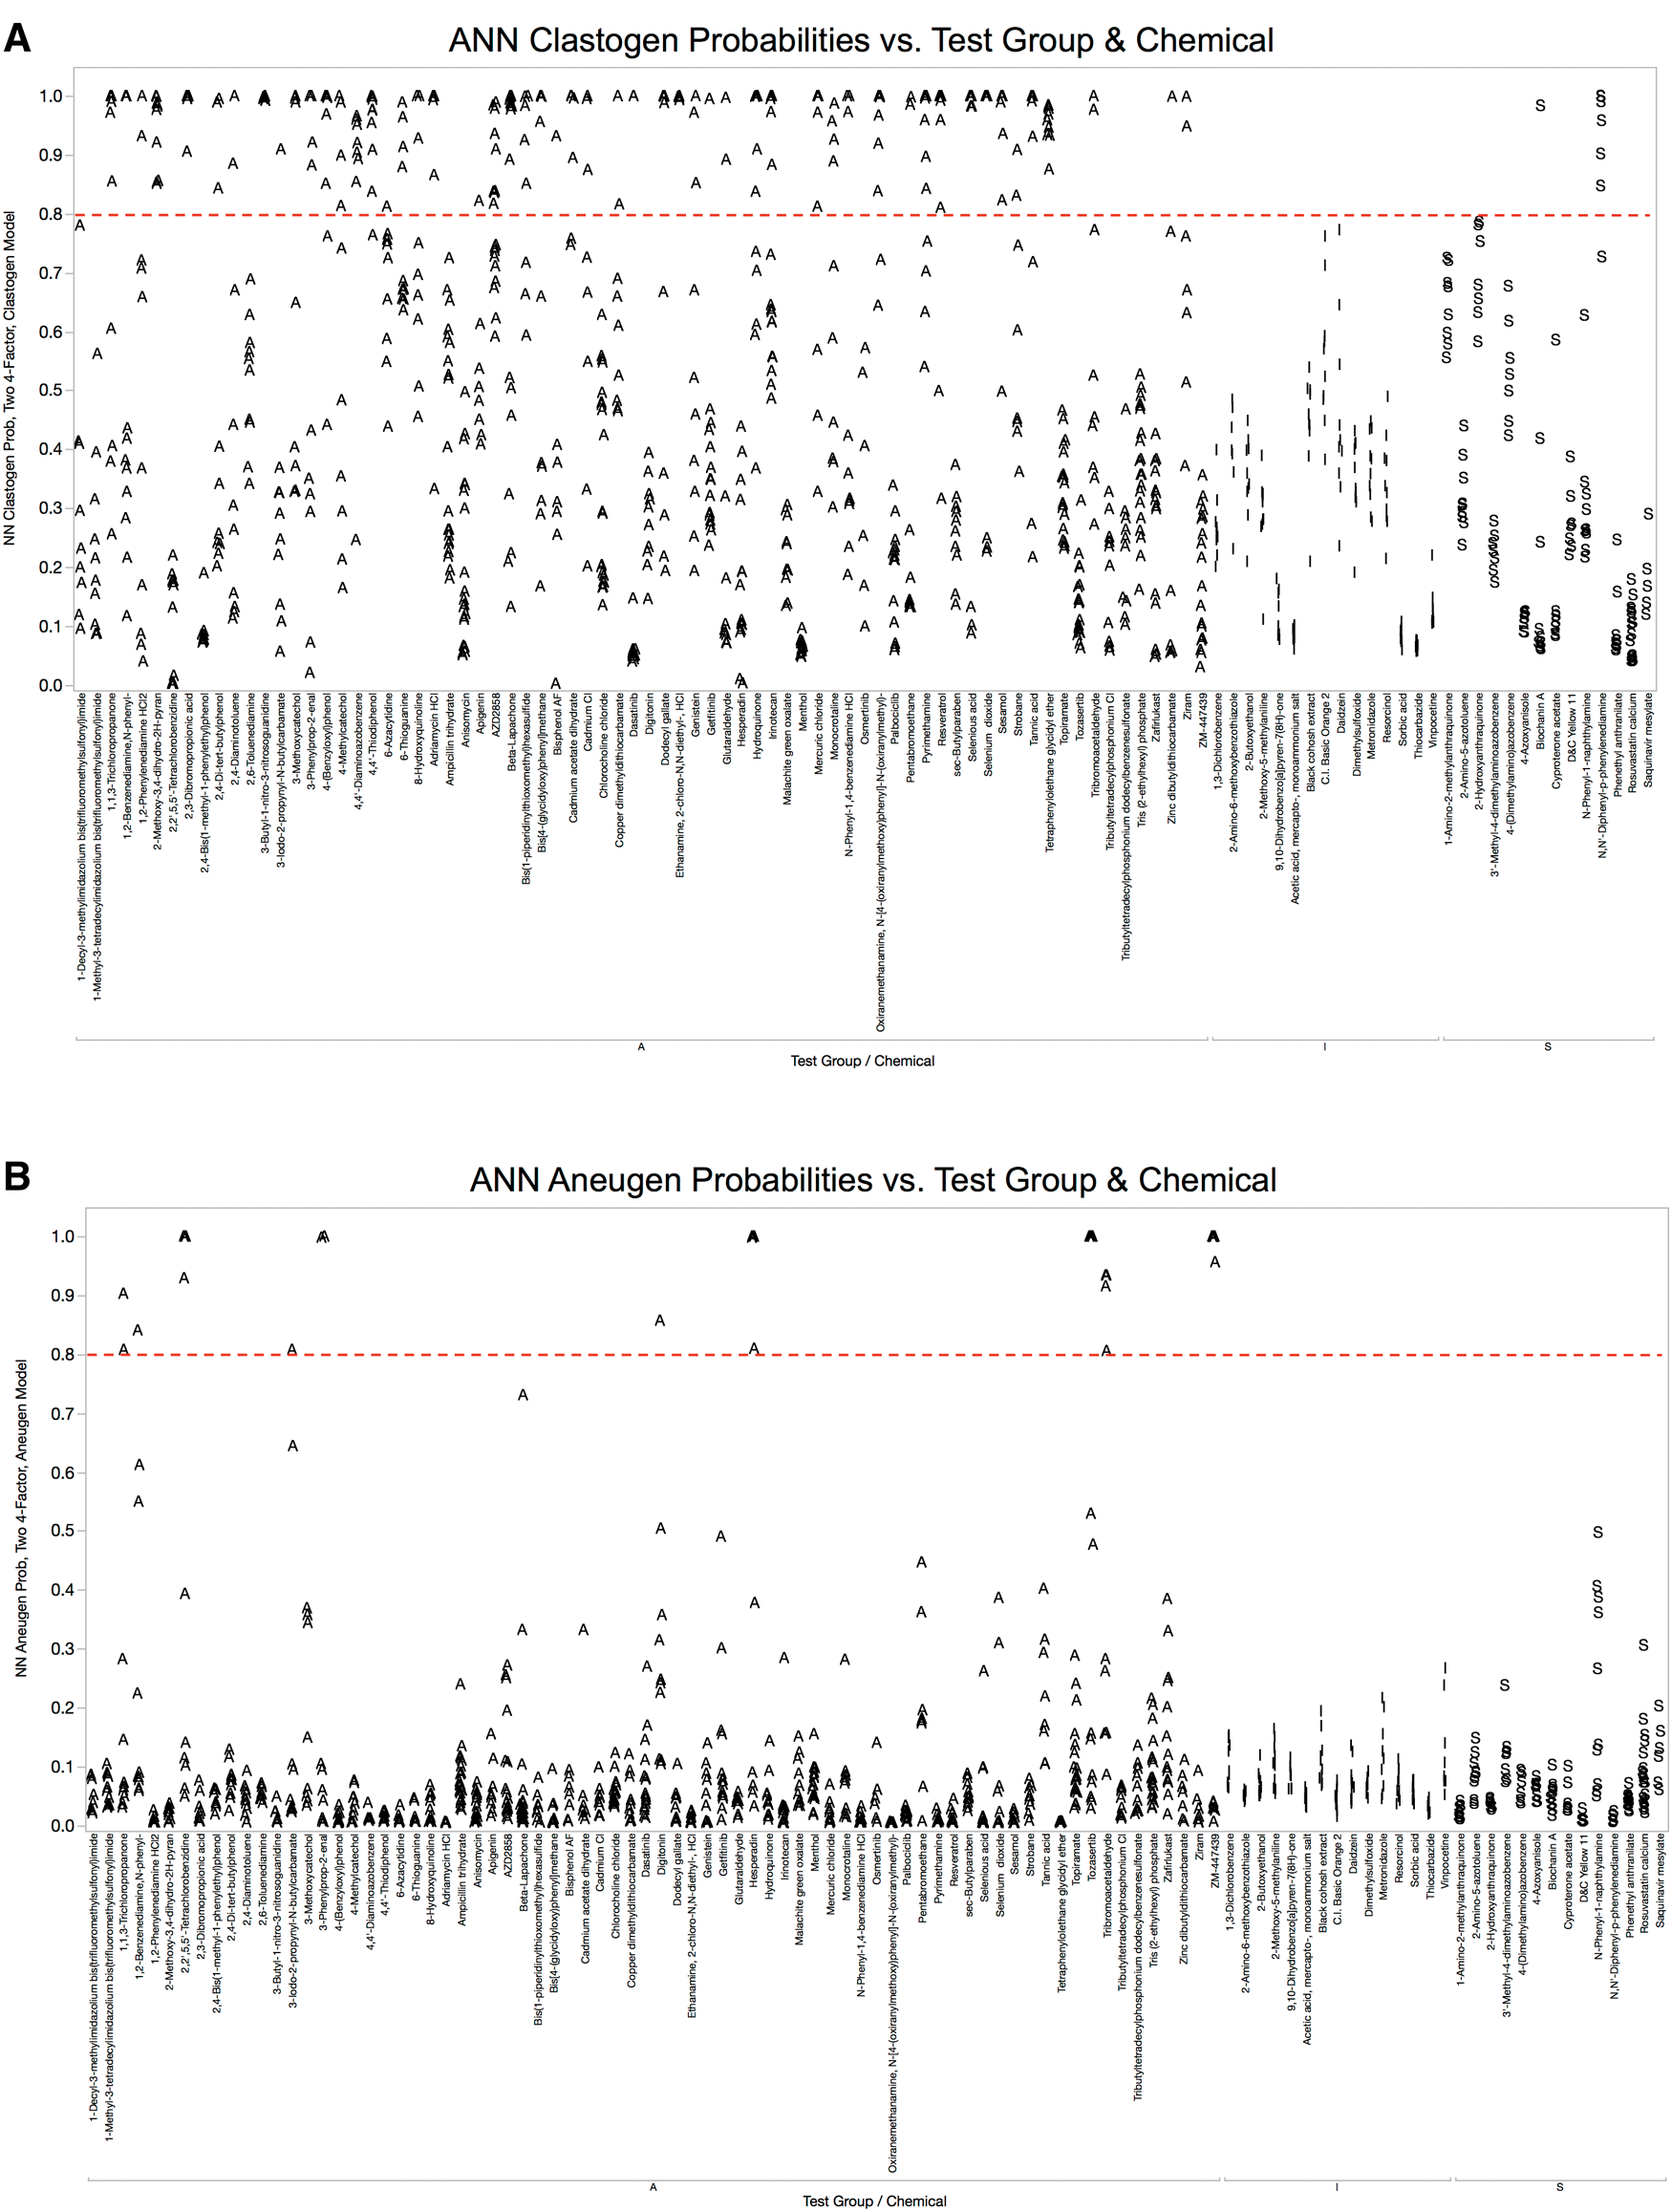
Figure 3. ANN probabilities for clastogen and aneugen classification
A, ANN probabilities for clastogen classification are graphed for each of 103 chemicals that were evaluated in TK6 cells with the MultiFlow DNA Damage assay.
Chemicals are grouped according to class: A, adequately tested; I, inadequately tested; S, top concentration limited by solubility. A series of probabilities are plotted for each chemical, with each point representing a different concentration. A dashed line indicates the threshold value that probability scores had to reach in order to be considered significant.
B, ANN probabilities for aneugen classification are graphed for each of 103 chemicals that were evaluated in TK6 cells with the MultiFlow DNA Damage assay.
Chemicals are grouped according to class: A, adequately tested; I, inadequately tested; S, top concentration limited by solubility. A series of probabilities are plotted for each chemical, with each point representing a different concentration. A dashed line indicates the threshold value that probability scores had to reach in order to be considered significant.
- Figure 3 (1 MB)
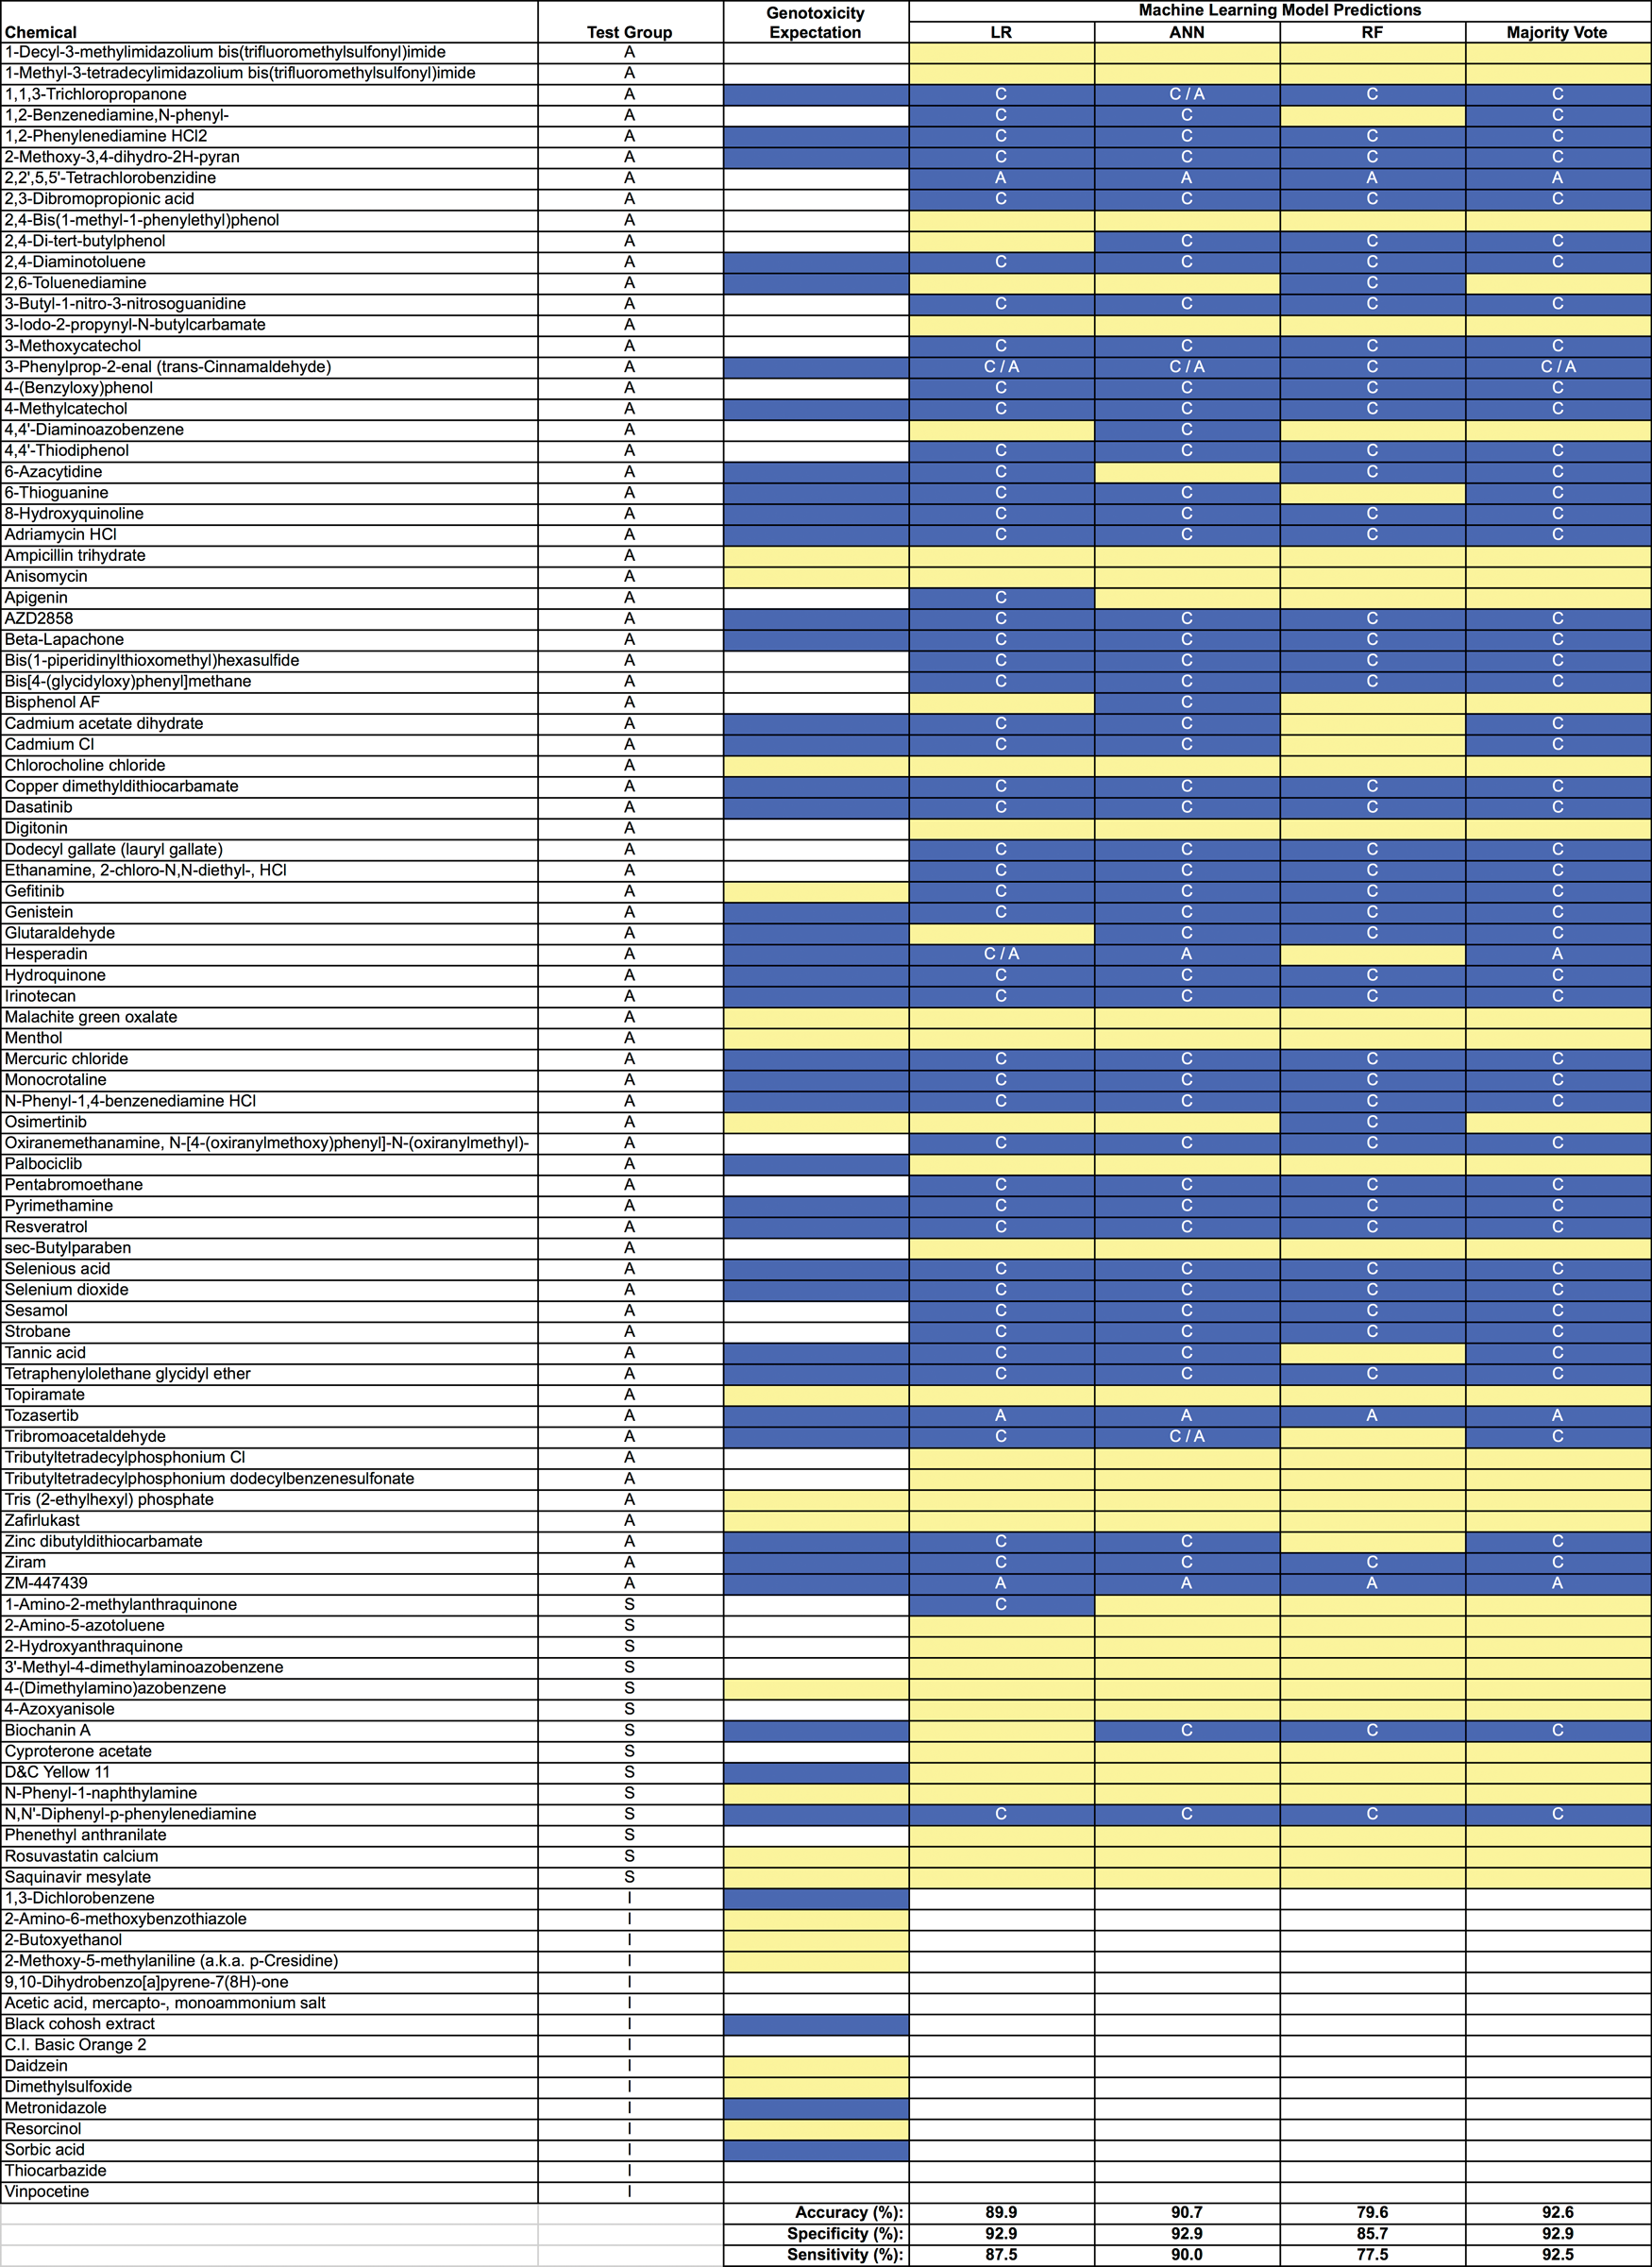
Figure 4. Information on 103 chemicals.
Information on 103 chemicals including expected and observed in vitro mammalian cell genotoxicity results is provided.
Chemicals are grouped according to class: A, adequately tested; S, top concentration limited by solubility; I, inadequately tested. White cells in the “Genotoxicity Expectation” column indicate there is too little conventional genotoxicity data to form an opinion about DNA damage potential; yellow cells (gray in print version) denote a nongenotoxic expectation, and blue cells (black in print version) indicate an expectation of in vitro genotoxic activity in the absence of metabolic activation. Observed results are provided in the 4 right-most columns and are based on MultiFlow assay data in conjunction with LR, ANN, and RF models, as well as a majority vote ensemble. In these columns white cells indicate that no call could be made due to inadequate testing (stock chemical concentration provided was too low); yellow cells (gray in print version) indicate a negative result; and blue cells (black in print version) denote a positive call. Note that when a genotoxic call was made, the following abbreviations indicate the predicted MoA: C, clastogen, A, aneugen, C/A, evidence of both. The performance metrics shown at the bottom are based on A and S class chemicals with a negative or positive genotoxicity expectation (n = 54).
- Figure 4 (2 MB)
Figure 5. Biomarker response data are graphed for 6-thioguanine-exposed/ZM-447439-exposed TK6 cells.
A, Biomarker response data are graphed for 6-thioguanine-exposed TK6 cells versus concentration. The bottom middle panel shows clastogen probabilities as a function of 6-thioguanine concentration based on 3 machine learning algorithms: LR, ANN, and RF. The bottom right panel shows analogous aneugen probability scores.
B, Biomarker response data are graphed for ZM-447439-exposed TK6 cells versus concentration. The bottom middle panel shows clastogen probabilities as a function of ZM-447439 concentration based on 3 machine learning algorithms: LR, ANN, and RF. The bottom right panel shows analogous aneugen probability scores.
C, Biomarker response data are graphed for tribromoacetaldehyde-exposed TK6 cells versus concentration. The bottom middle panel shows clastogen probabilities as a function of tribromoacetaldehyde concentration based on 3 machine learning algorithms: LR, ANN, and RF. The bottom right panel shows analogous aneugen probability scores.
- Figure 5 (867 KB)
Tables
Table 1. Test Chemical Information
a
Test Group A: adequately tested, either positive by at least 1 analysis method, or if negative tested to limit conc. or approached/achieved cytotoxicity limit, n = 74; Group S: top concentration limited by solubility (in DMSO), n = 14. Group I: inadequately tested, negative result and did not approach or achieve cytotoxicity limit, and did not reach limit conc. or solubility limit, n = 15.
b
Unless otherwise stated Ames and in vitro mammalian cell results refer to test conditions in the absence of exogenous metabolic activation.
c
Insufficient means an expected in vitro mammalian cell genotoxicity call cannot be made at this time for lack of sufficient conventional genotoxicity data.
- Table 1 (317 KB)