

Assessment of the DNA Damaging Potential of Environmental Chemicals Using a Quantitative High-throughput Screening Approach to Measure p53 Activation
Witt KL, Hsieh JH, Smith-Roe SL, Xia M, Huang R, Zhao J, Auerbach SS, Hur J, Tice RR.
Environmental and Molecular Mutagenesis (2017)
DOI: https://doi.org/10.1002/em.22112
PMID: 28714573
Publication
Abstract
Genotoxicity potential is a critical component of any comprehensive toxicological profile. Compounds that induce DNA or chromosomal damage often activate p53, a transcription factor essential to cell cycle regulation. Thus, within the US Tox21 Program, we screened a library of ∼10,000 (∼8,300 unique) environmental compounds and drugs for activation of the p53-signaling pathway using a quantitative high-throughput screening assay employing HCT-116 cells (p53+/+ ) containing a stably integrated β-lactamase reporter gene under control of the p53 response element (p53RE). Cells were exposed (-S9) for 16 hr at 15 concentrations (generally 1.2 nM to 92 μM) three times, independently. Excluding compounds that failed analytical chemistry analysis or were suspected of inducing assay interference, 365 (4.7%) of 7,849 unique compounds were concluded to activate p53. As part of an in-depth characterization of our results, we first compared them with results from traditional in vitro genotoxicity assays (bacterial mutation, chromosomal aberration); ∼15% of known, direct-acting genotoxicants in our library activated the p53RE. Mining the Comparative Toxicogenomics Database revealed that these p53 actives were significantly associated with increased expression of p53 downstream genes involved in DNA damage responses. Furthermore, 53 chemical substructures associated with genotoxicity were enriched in certain classes of p53 actives, for example, anthracyclines (antineoplastics) and vinca alkaloids (tubulin disruptors). Interestingly, the tubulin disruptors manifested unusual nonmonotonic concentration response curves suggesting activity through a unique p53 regulatory mechanism. Through the analysis of our results, we aim to define a role for this assay as one component of a comprehensive toxicological characterization of large compound libraries. Environ. Mol. Mutagen. 58:494-507, 2017.
Figures
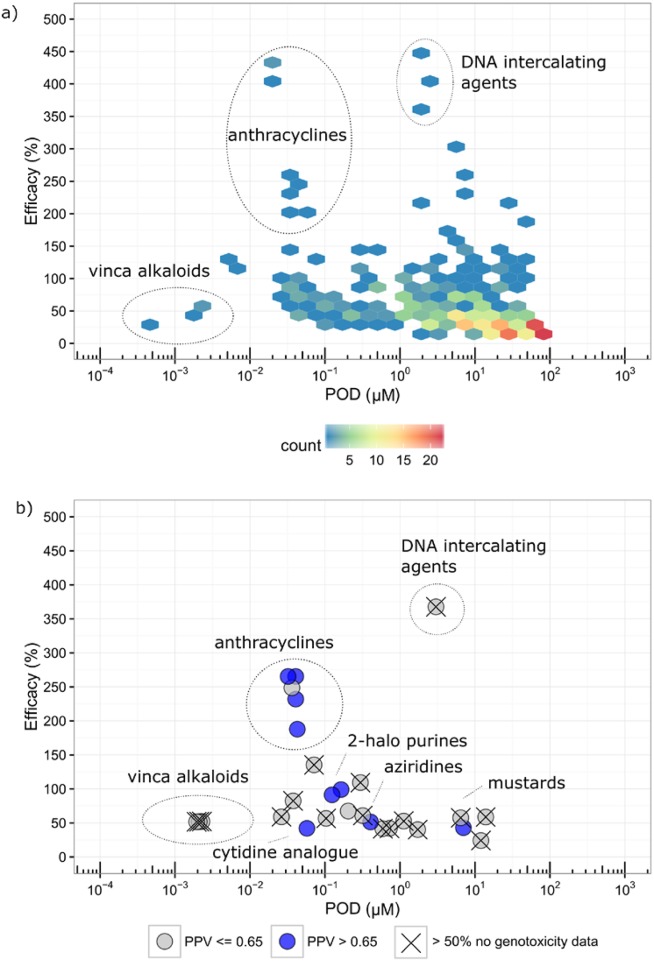
Figure 1. Distribution of potency and efficacy values.
(a) Distribution of potency and efficacy values for compounds active in the p53RE assay. (b) Distribution of potency and efficacy values for structural fingerprints that are enriched with compounds active in the p53RE assay. POD, point of departure; PPV, positive predictive value.
- Figure 1 (118 KB)
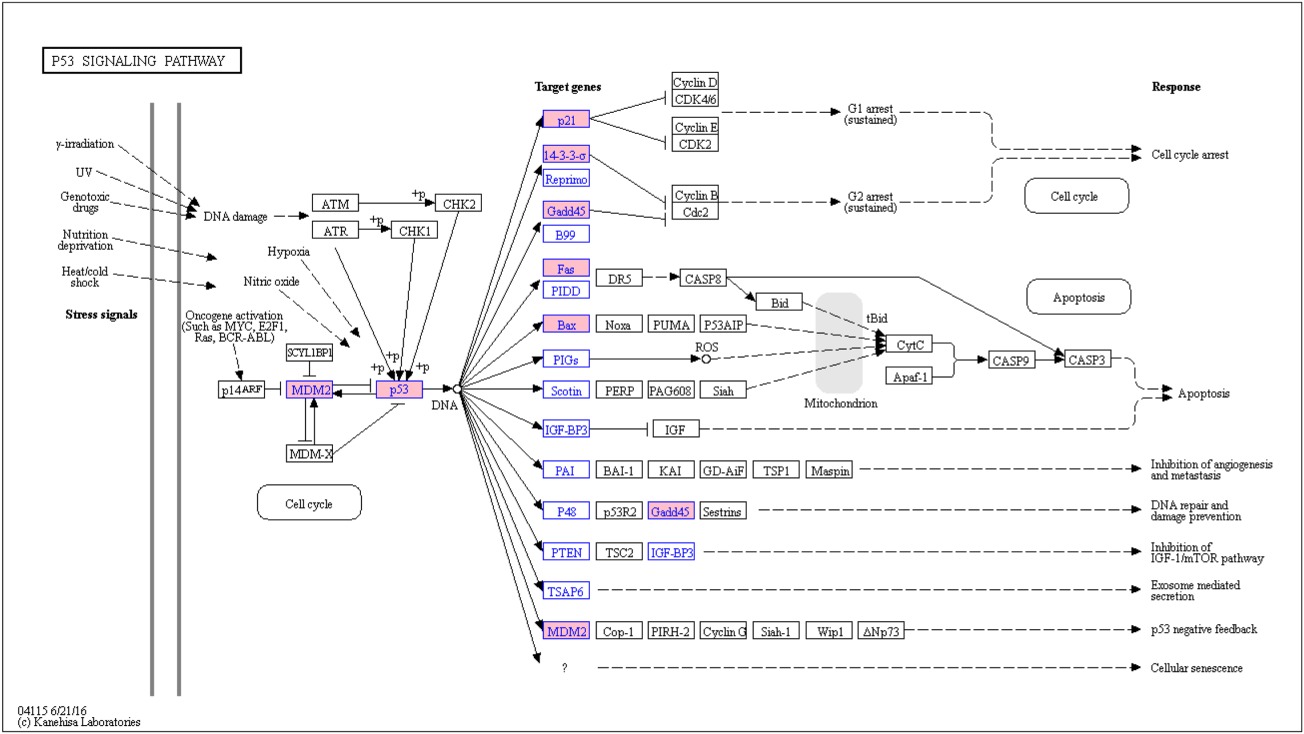
Figure 2. Association analysis between chemical activity in the p53RE assay.
Association analysis between chemical activity in the p53RE assay and chemical‐induced increased expression of downstream genes in the p53 signaling pathway. Blue text: chemical‐gene data applied in the analysis; pink background: significant association between chemical activity in the p53RE assay and chemical‐induced increased expression of the gene. Plot created by KEGG Mapper, http://www.kegg.jp/kegg/mapper.html.
- Figure 2 (152 KB)
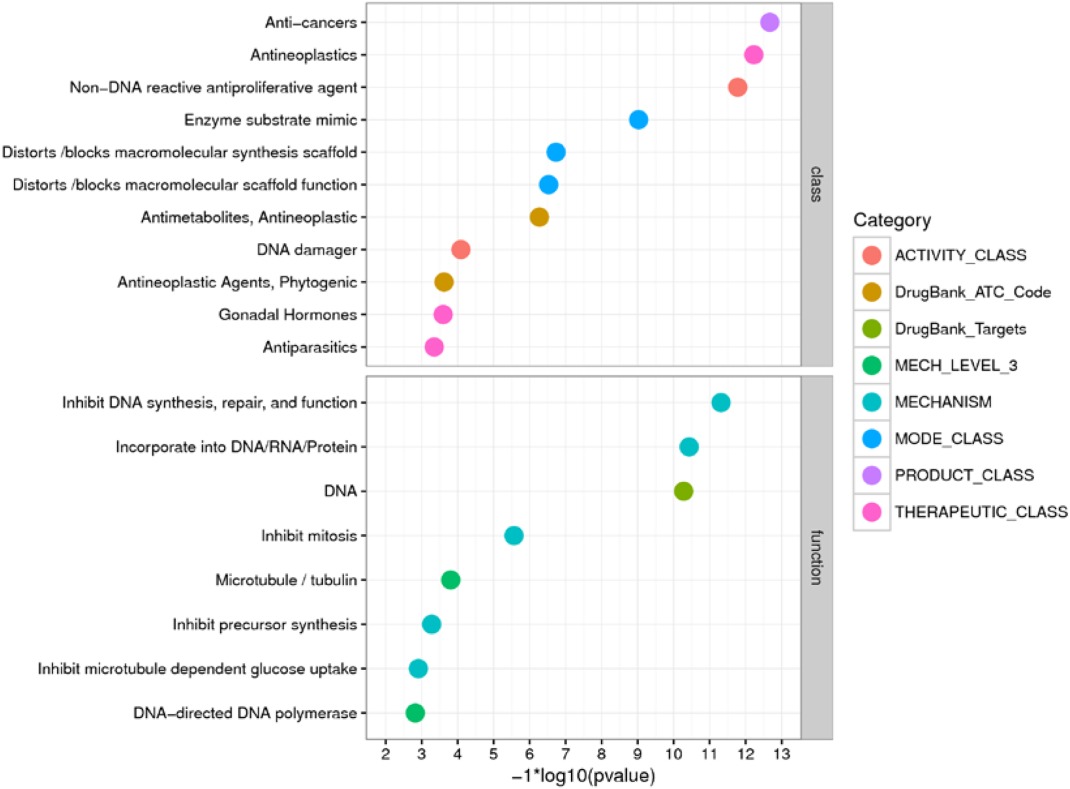
Figure 3. Association analysis between chemical activity in the p53RE assay and chemical annotations
Association analysis between chemical activity in the p53RE assay and chemical annotations. Terms for chemical annotations are taken directly from the DrugMatrix and DrugBank databases; ATC: WHO drug classification system (ATC) identifiers. For additional descriptions of the categories, please refer to Supporting Information, Methods.
- Figure 3 (110 KB)
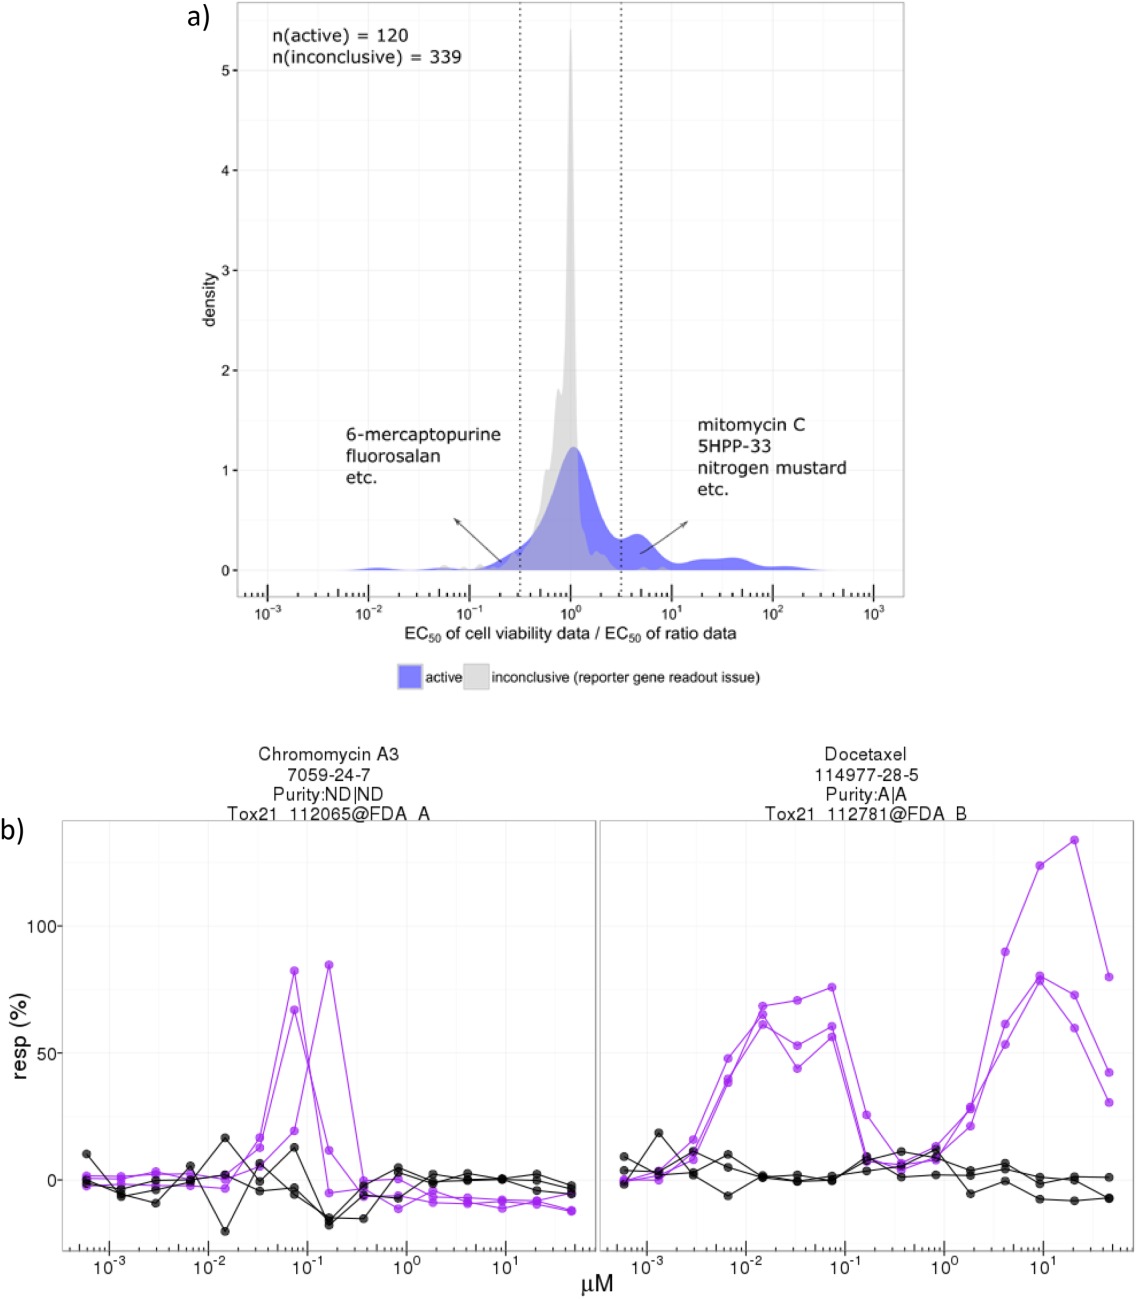
Figure 4. Distribution of the fold change of the EC50 values, and Examples of dose–response curves.
(a) Distribution of the fold change of the EC50 values for the cell viability data and the EC50 values for the p53RE ratio data. Dotted vertical lines indicate 3.2‐fold difference between ratio data and cytotoxicity, where cytotoxicity occurs at higher concentrations (right side) or lower concentrations (left side) than the p53RE response.
(b) Examples of dose–response curves of known (docetaxel) and potential (chromomycin A3) tubulin inhibitors. Purple: ratio data; black: cell viability data. Plots generated by https://ntp.niehs.nih.gov/sandbox/tox21-curve-visualization/.
- Figure 4 (151 KB)
Tables
Table 1. Protocol for the p53RE qHTS Assay
- Table 1 (126 KB)
Table 2. Association analysis.
Association analysis between chemical activity in the p53RE assay and chemical‐induced increased expression of downstream genes in the p53 signaling pathway
- Table 2 (140 KB)
Table 3. Comparison of p53RE qHTS Assay Activity Calls and QSAR Model Predictions.
Comparison of p53RE qHTS Assay Activity Calls and QSAR Model Predictions for Bacterial Mutagenicity or Traditional Genotoxicity Assay Results
- Table 3 (103 KB)
Supplemental Materials
Supporting Information
- Supplemental Material (2 MB)
- Supporting Information (615 KB)