

An Intuitive Approach for Predicting Potential Human Health Risk with the Tox21 10k Library
Sipes NS, Wambaugh JF, Pearce R, Auerbach SS, Wetmore BA, Hsieh JH, Shapiro AJ, Svoboda D, DeVito MJ, Ferguson SS.
Environmental Science & Technology (2017)
DOI: https://doi.org/10.1021/acs.est.7b00650
PMID: 27814246
Publication
Abstract
In vitro-in vivo extrapolation (IVIVE) analyses translating high-throughput screening (HTS) data to human relevance have been limited. This study represents the first report applying IVIVE approaches and exposure comparisons using the entirety of the Tox21 federal collaboration chemical screening data, incorporating assay response efficacy and quality of concentration-response fits, and providing quantitative anchoring to first address the likelihood of human in vivo interactions with Tox21 compounds. This likelihood was assessed using a maximum blood concentration to in vitro response ratio approach (Cmax/AC50), analogous to decision-making methods for clinical drug-drug interactions. Fraction unbound in plasma (fup) and intrinsic hepatic clearance (CLint) parameters were estimated in silico and incorporated in a three-compartment toxicokinetic (TK) model to first predict Cmax for in vivo corroboration using therapeutic scenarios. Toward lower exposure scenarios, 36 compounds of 3925 unique chemicals with curated activity in the HTS data using high-quality dose-response model fits and ≥40% efficacy gave "possible" human in vivo interaction likelihoods lower than median human exposures predicted in the United States Environmental Protection Agency's ExpoCast program. A publicly available web application has been designed to provide all Tox21-ToxCast dose-likelihood predictions. Overall, this approach provides an intuitive framework to relate in vitro toxicology data rapidly and quantitatively to exposures using either in vitro or in silico derived TK parameters and can be thought of as an important step toward estimating plausible biological interactions in a high-throughput risk-assessment framework.
Figures
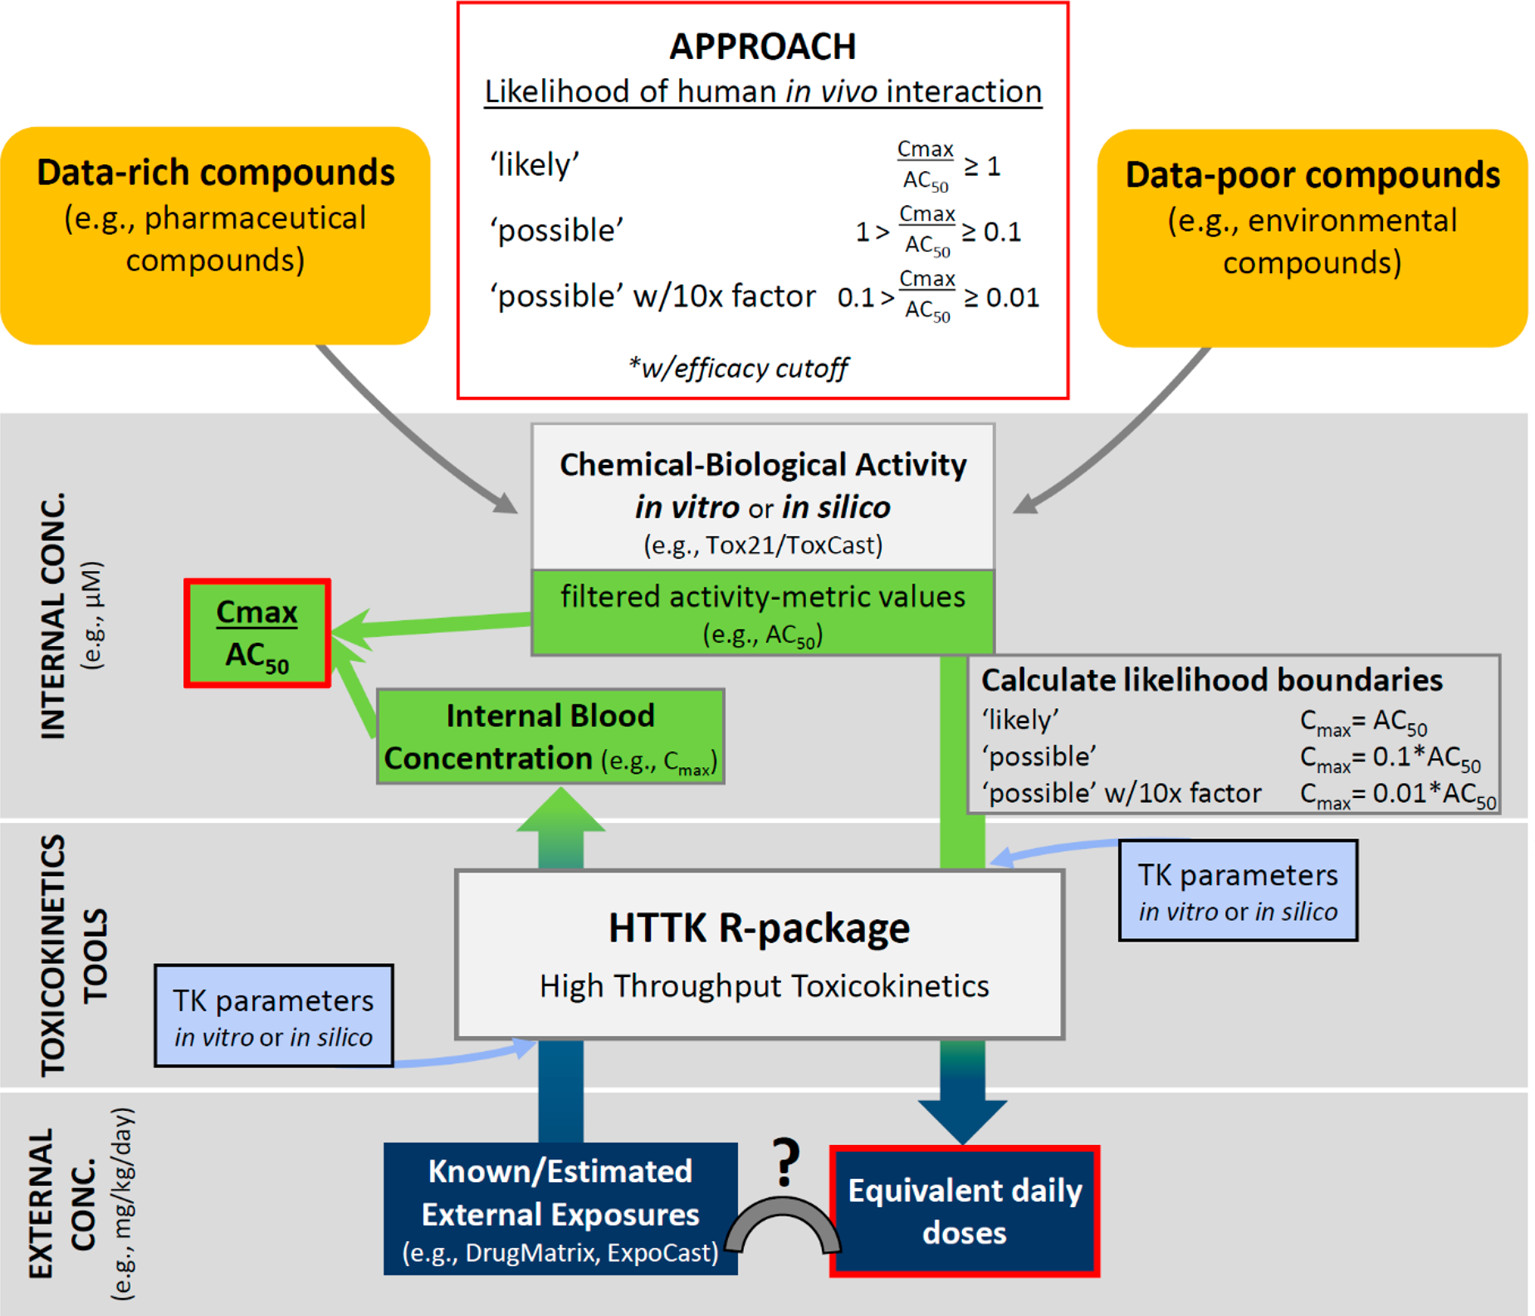
Figure 1. Fit-for-purpose risk-based framework for in vitro–in vivo extrapolation.
Both data-rich and data-poor compounds can utilize this simplistic approach with a noncommercial toxicokinetics model (HTTK) for predicting the likelihood of in vivo interaction based on in vitro and/or in silico compound-biological activity (e.g., AC50 and efficacy). Data-rich compounds with known chemical-biological activities can be directly compared to measured in vivo Cmax values or estimated values using the HTTK model, based on known external intake exposures (such as pharmaceutical dosing) and in vitro or in silico TK parameters. Data-poor compounds can be synthesized in small quantities for evaluation in high-throughput assays (e.g., Tox21−ToxCast) for chemical–biological activity. Alternatively, bioactivity may be estimated in silico if a model is available. These data can then be applied to forecast equivalent daily dose exposures in Cmax boundary limits using a steady-state HTTK model along with in silico or in vitro TK parameters. Measured or estimated external exposures (as obtained) can be directly compared to the equivalent daily dose exposures.
- Figure 1 (396 KB)
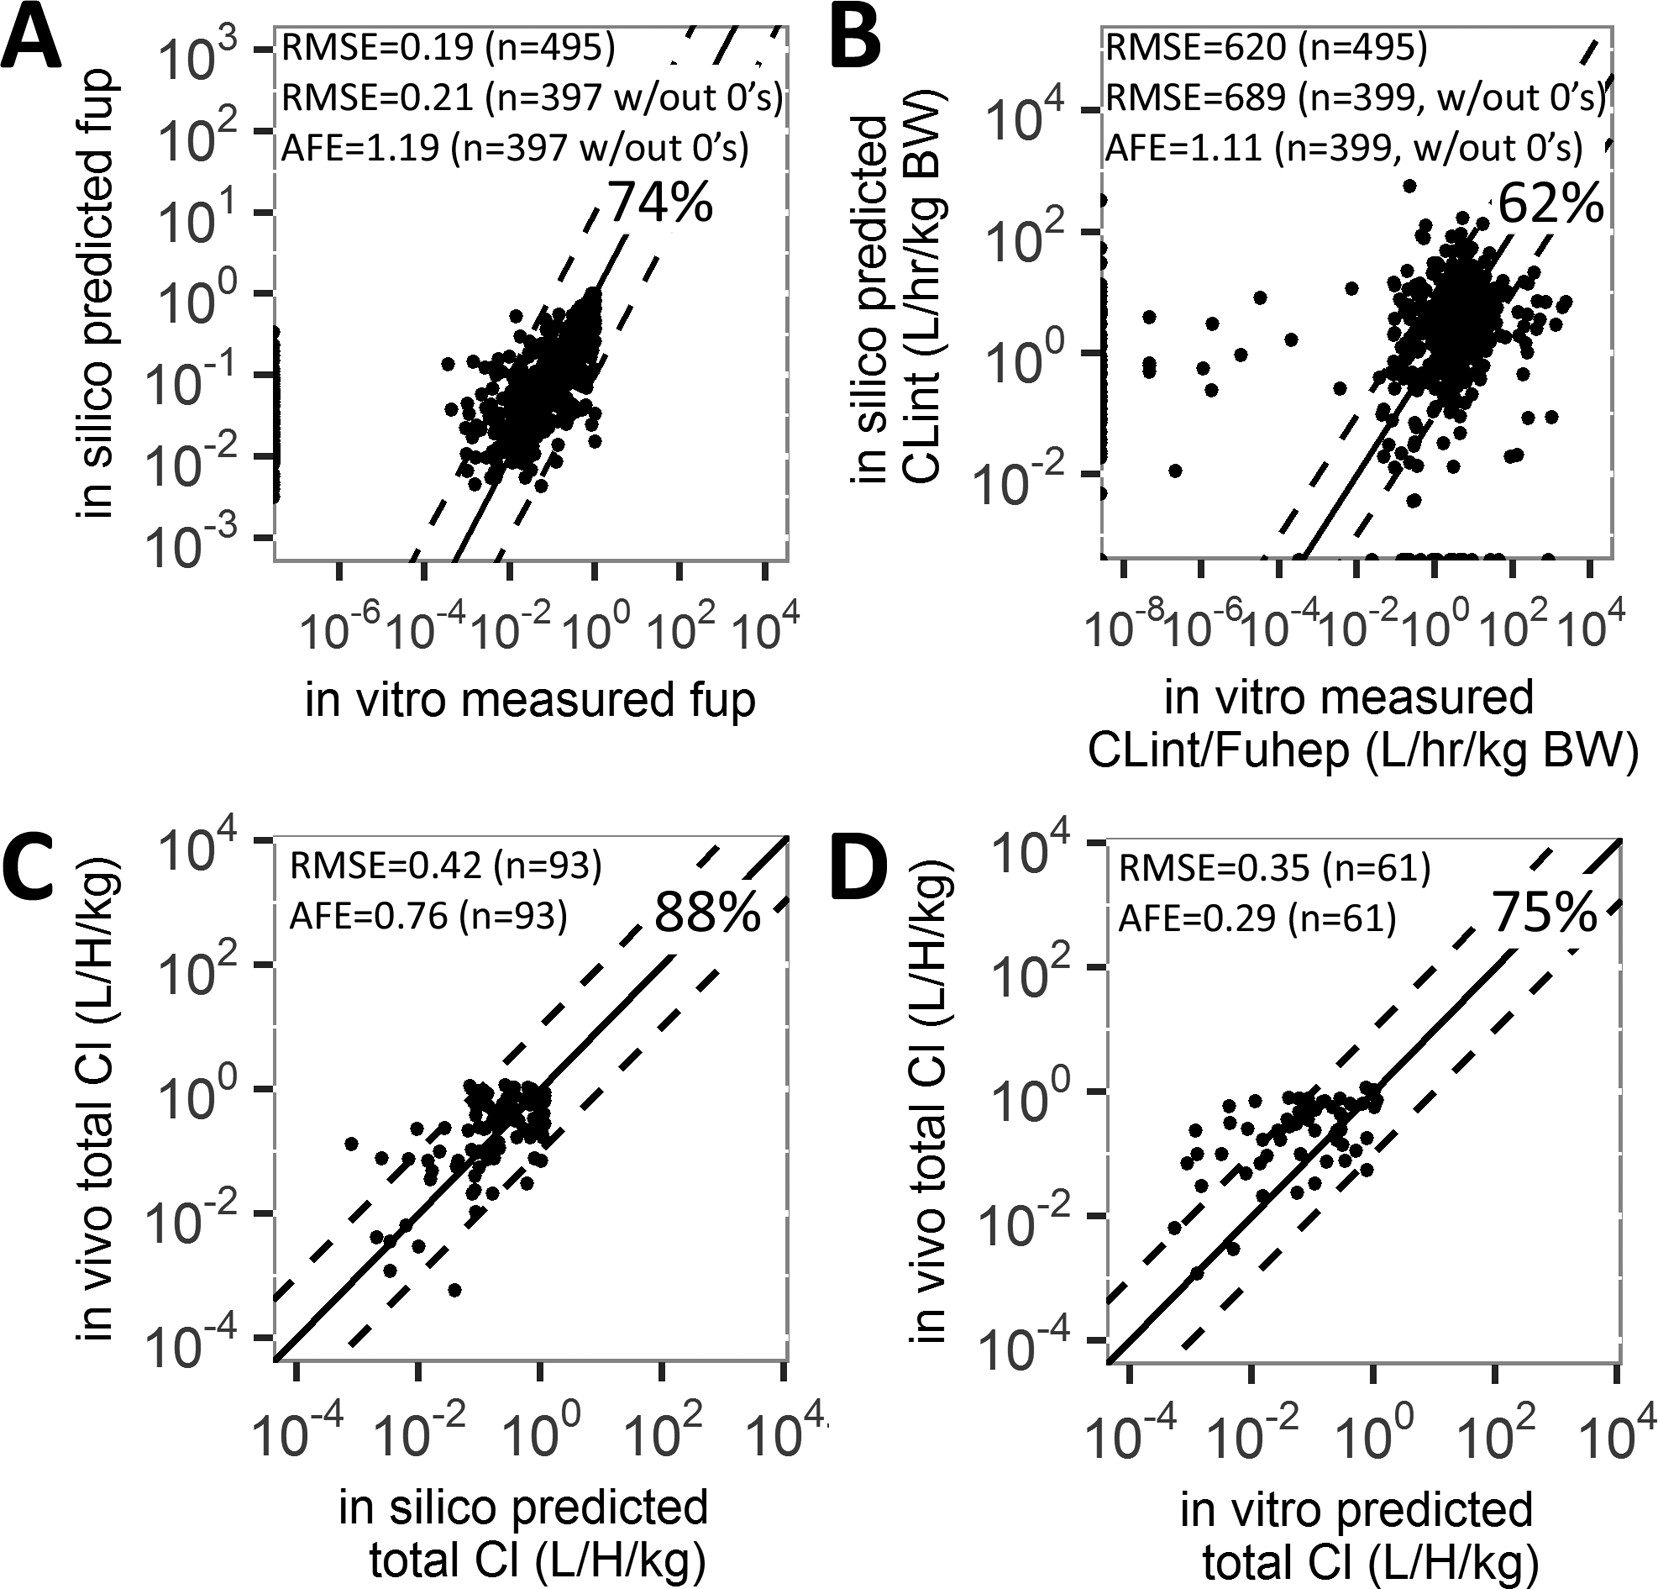
Figure 2. Fraction-unbound, hepatic-clearance, and total-clearance prediction comparisons.
fup and CLint parameters were compared between in vitro measured values and in silico estimates for 495 Tox21 chemicals (A, B). In vivo total CLint values were compared to values estimated with the HTTK package using in silico parameters (93 chemicals, panel C) and in vitro parameters (61 chemicals, panel D). Solid line is 1:1, and dotted lines are 1 log10 difference, with the percentage of data lying within; total number of chemicals (n), root mean squared error (RMSE), and average fold error (AFE) are noted. A total of 98 chemicals had no detectible fup from in vitro methods (A). A total of 36 and 78 chemicals were determined to have zero CLint values using in silico or in vitro methods, respectively (B).
- Figure 2 (392 KB)
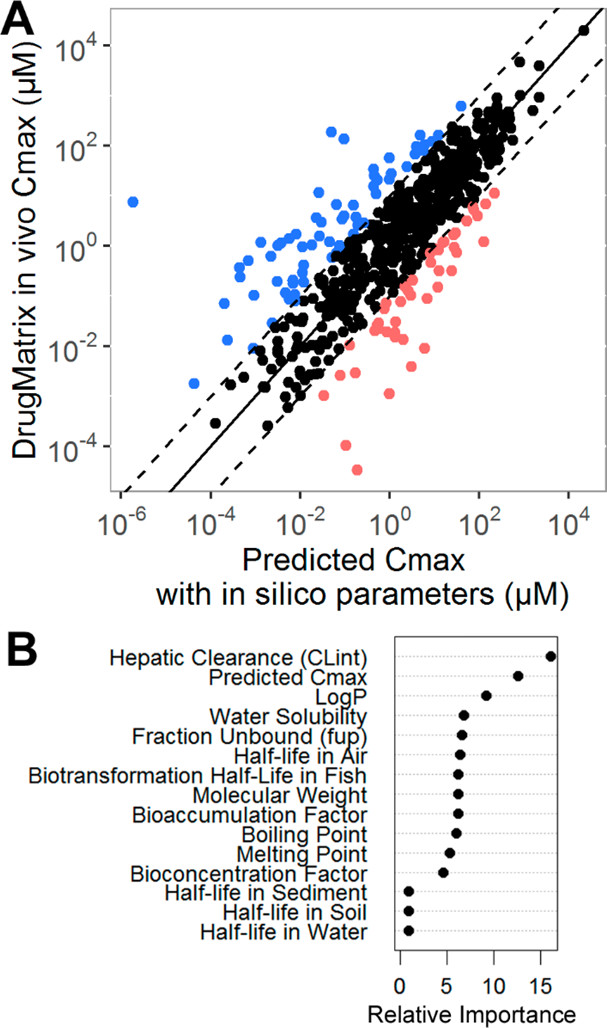
Figure 3. Maximum human plasma concentration prediction comparison.
Cmax was compared between predicted in silico values using the HTTK package and measured human in vivo values gathered in DrugMatrix(46, 55) for 491 Tox21 chemicals and 613 dosing scenarios at pharmacologically relevant doses. (A) HTTK package with in silico parameters predicted Cmax with RMSE = 211.04 and AFE = 0.80. For most cases, Cmax was predicted within 10-fold (493 scenarios, 80%, black), under-predicted >10-fold (48 scenarios, 8%, blue), and overpredicted >10-fold (72 scenarios, 12%, red). (B) A total of 15 features used for predicting compound-scenario Cmax values over-, under-, or within- 10-fold are ordered by importance based on the random forest model. Random forest model performance for estimating confidence is described in the Supporting Information.
- Figure 3 (193 KB)
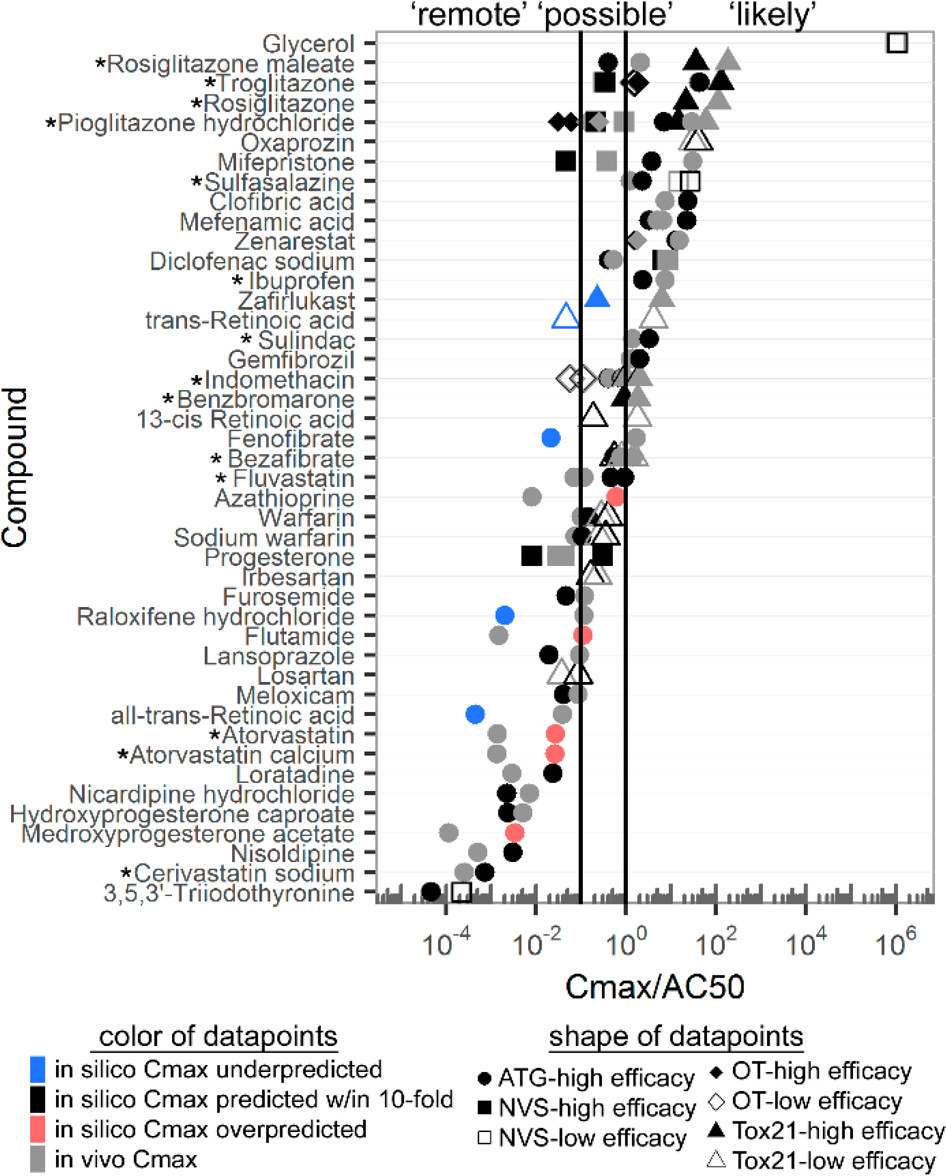
Figure 4. Cmax-to-AC50 ratios for the PPARγ pathway at pharmacological doses.
Compounds with in vivo dosing scenarios and human Cmax values as well as in vitro AC50 values in PPARγ Tox21−ToxCast assays were evaluated for the likelihood of in vivo interactions. For 44 active compounds in PPARγ assays, Cmax-to-AC50 ratios were plotted using the in vivo Cmax from DrugMatrix and in silico estimated Cmax, based on therapeutic external dose. Assays included: (1) Attagene (ATG), (2) NovaScreen (NVS) cell-free human PPARγ binding, (3, 4) two OdysseyThera (OT), and (5) Tox21. Chemicals listed were active in at least one assay. Activity across multiple assays are indicated by multiple data points on the same row. Colored data points indicate the accuracy of in silico predicted Cmax values (blue, black, and red) vs in vivo measured Cmax value (gray). Vertical lines at 0.1 and 1 show regions of “remote” (<0.1), “possible” (0.1 < X < 1), and “likely” (>1) in vivo interaction. Efficacies greater than 40% or 2-fold change are considered high efficacy, and all others are considered low efficacy. Asterisks indicate known modulators.
- Figure 4 (307 KB)
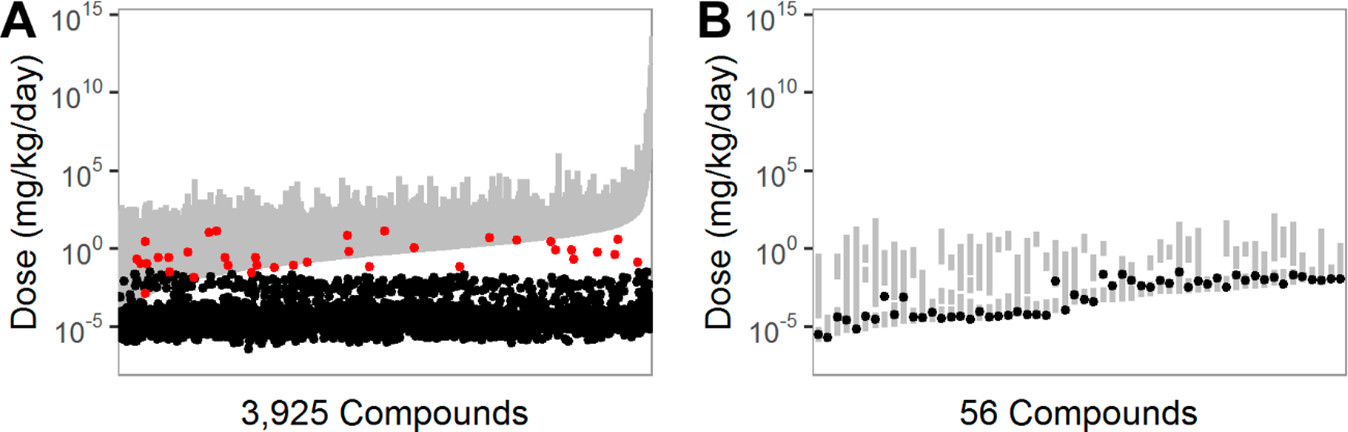
Figure 5. Dose ranges for all active Tox21 compounds eliciting a “possible”-to-“likely”.
Dose ranges for all active Tox21 compounds eliciting a “possible”-to-“likely” human in vivo interaction alongside estimated daily exposure. (A) AC50 values for all 49 789 active Tox21 compound–assays pairs (3925 unique compounds) with efficacies of ≥40% or 2-fold in the HTS assays were converted to equivalent human doses to elicit a “likely” or “possible” in vivo interaction. These are defined as doses giving maximum in vivo plasma concentrations equal to 1 and 0.1 of the AC50 concentration (“likely” and “possible” in vivo interactions, respectively; gray bars). A chemical can affect multiple assays leading to varying sizes of gray bars. ExpoCast exposure predictions(23) are shown in terms of dose per day (black dots). Given for reference, red dots indicate therapeutic daily doses for pharmaceuticals at dosing schema from the DrugMatrix database. (B) 56 compounds with overlapping gray bars and black dots (from panel A) indicate potential in vivo biological interaction at estimated environmental exposures.
- Figure 5 (128 KB)
Figure 6. Doses of compounds eliciting a “possible” human in vivo interaction (Cmax/AC50 > 0.1).
Doses of compounds eliciting a “possible” human in vivo interaction (Cmax/AC50 > 0.1), which are lower than estimated daily exposure. AC50 values for active Tox21−ToxCast compounds with efficacies of ≥40% or 2-fold in the HTS assays were converted to equivalent human in vivo doses using exposure scenarios where in vivo Cmax concentrations were equal to 0.1 × AC50 to represent “possible” in vivo interactions. ExpoCast median daily exposure estimates(23) are shown as open triangles. Predicted doses for chemical–assay pairs are shown (dots) for chemicals that had predicted doses below exposure estimates and had higher confidence in calculating the doses from estimate Cmax values. Biological targets for compounds in which doses are lower than estimated exposures (i.e., black data points to the left of the triangles) are shown in the right panel. Gray dots indicate doses needed to activate biology that are higher than estimated exposures. Similar visualizations of all HTS and ExpoCast data in this manuscript can be found in the public IVIVE web application (https://sandbox.ntp.niehs.nih.gov/ivive/).
- Figure 6 (327 KB)