

Shifts in the Gut Microbiota Composition Due to Depleted Bone Marrow Beta Adrenergic Signaling Are Associated with Suppressed Inflammatory Transcriptional Networks in the Mouse Colon
Tao Yang, Niousha Ahmari, Jordan T. Schmidt, Ty Redler, Rebeca Arocha, Kevin Pacholec, Kacy L. Magee, Wendi Malphurs, Jennifer L. Owen, Gregory A. Krane, Eric Li, Gary P. Wang, Thomas W. Vickroy, Mohan K. Raizada, Christopher J. Martyniuk, and Jasenka Zubcevic.
Frontiers in Physiology (2017)
DOI: https://doi.org/10.3389/fphys.2017.00220
PMID: 28446880
Publication
Abstract
The brain-gut axis plays a critical role in the regulation of different diseases, many of which are characterized by sympathetic dysregulation. However, a direct link between sympathetic dysregulation and gut dysbiosis remains to be illustrated. Bone marrow (BM)-derived immune cells continuously interact with the gut microbiota to maintain homeostasis in the host. Their function is largely dependent upon the sympathetic nervous system acting via adrenergic receptors present on the BM immune cells. In this study, we utilized a novel chimera mouse that lacks the expression of BM beta1/2 adrenergic receptors (b1/2-ARs) to investigate the role of the sympathetic drive to the BM in gut and microbiota homeostasis. Fecal analyses demonstrated a shift from a dominance of Firmicutes to Bacteroidetes phylum in the b1/2-ARs KO chimera, resulting in a reduction in Firmicutes/Bacteroidetes ratio. Meanwhile, a significant reduction in Proteobacteria phylum was determined. No changes in the abundance of acetate-, butyrate-, and lactate-producing bacteria, and colon pathology were observed in the b1/2-ARs KO chimera. Transcriptomic profiling in colon identified Killer Cell Lectin-Like Receptor Subfamily D, Member 1 (Klrd1), Membrane-Spanning 4-Domains Subfamily A Member 4A (Ms4a4b), and Casein Kinase 2 Alpha Prime Polypeptide (Csnk2a2) as main transcripts associated with the microbiota shifts in the b1/2-ARs KO chimera. Suppression of leukocyte-related transcriptome networks (i.e., function, differentiation, migration), classical compliment pathway, and networks associated with intestinal function, barrier integrity, and excretion was also observed in the colon of the KO chimera. Moreover, reduced expression of transcriptional networks related to intestinal diseases (i.e., ileitis, enteritis, inflammatory lesions, and stress) was noted. The observed suppressed transcriptome networks were associated with a reduction in NK cells, macrophages, and CD4+ T cells in the b1/2-ARs KO chimera colon. Thus, sympathetic regulation of BM-derived immune cells plays a significant role in modifying inflammatory networks in the colon and the gut microbiota composition. To our knowledge, this study is the first to suggest a key role of BM b1/2-ARs signaling in host-microbiota interactions, and reveals specific molecular mechanisms that may lead to generation of novel anti-inflammatory treatments for many immune and autonomic diseases as well as gut dysbiosis across the board.
Figures
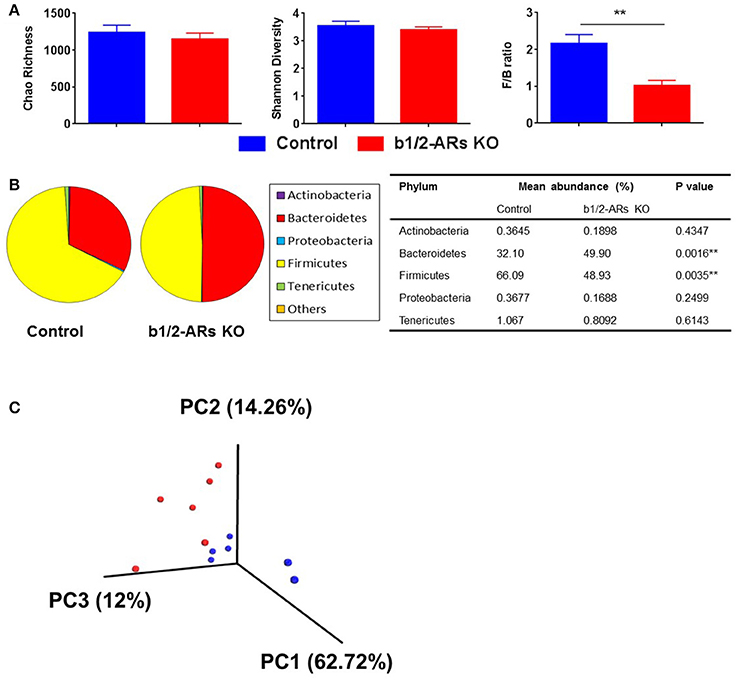
Figure 1. Altered gut microbiota in the b1/2-ARs KO chimera.
(A) No significant difference in gut microbiota richness or diversity between the b1/2-ARs KO chimera and C57 control chimera. However, the Firmicutes to Bacteroidetes (F/B) ratio was significantly lower in the b1/2-ARs KO chimera compared to the C57 control chimera. (B) The decreased F/B ratio is attributed to the significant expansion of Bacteroidetes and contraction of Firmicutes. (C) Unweighted Principal coordinate analysis (PCoA) demonstrated a clear separation of red and blue clusters representing C57 and b1/2-ARs KO chimera groups, respectively. ** indicates P < 0.01.
- Figure 1 (172 KB)
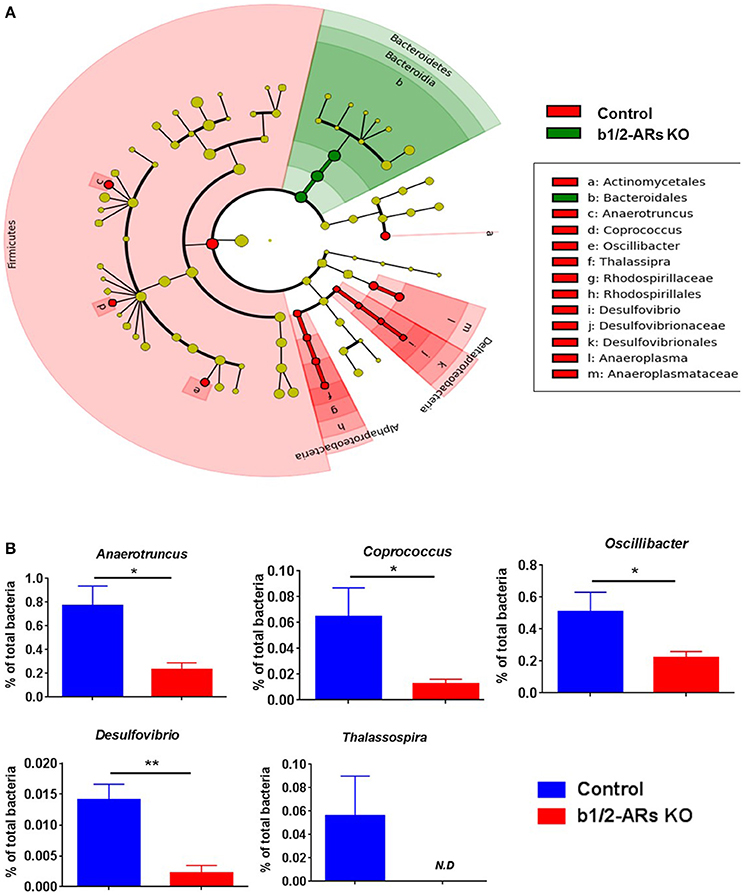
Figure 2. Contraction of Proteobacteria phylum in the b1/2-ARs KO chimera.
(A) Taxonomic cladogram was generated by performing linear discriminant analysis (LDA) of effect size (LEfSe) in Galaxy (Segata et al., 2011). Each circle dot represents a bacterial taxon with its diameter proportional to the taxon's relative abundance. Differences are represented in colors where red indicates significant relative abundance in C57 chimera, green indicates significant relative abundance in b1/2-ARs KO chimera, and yellow indicates no significant differences. (B) Unpaired two-tailed t-test analyses of genera with significant differences between b1/2-ARs KO chimera and C57 control chimera. * indicates P < 0.05 and ** indicates P < 0.01.
- Figure 2 (322 KB)
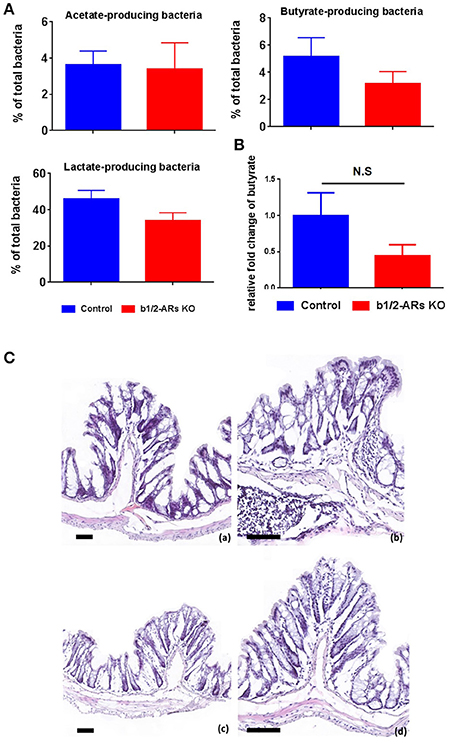
Figure 3. Functional and histologic evaluation in the C57 and b1/2-ARs KO chimera.
(A) SCFA-producing bacteria and butyrate production in the feces. Percentages of acetate-, butyrate-, and lactate- producing bacteria in total gut microbiota. (B) No significant changes in the production of butyrate in the b1/2-ARs KO chimera. (C) Histology of C57 (a,b) and b1/2-ARs KO chimera (c,d) colons. (Frozen sections stained with hematoxylin and eosin, 100X (a,c) & 200X (b,d) magnification, all bars indicate 80 μm). No significant histopathologic lesions were detected in the colons of both C57 and b1/2-ARs KO chimera mice, and no qualitative differences were detected between the two groups.
- Figure 3 (243 KB)
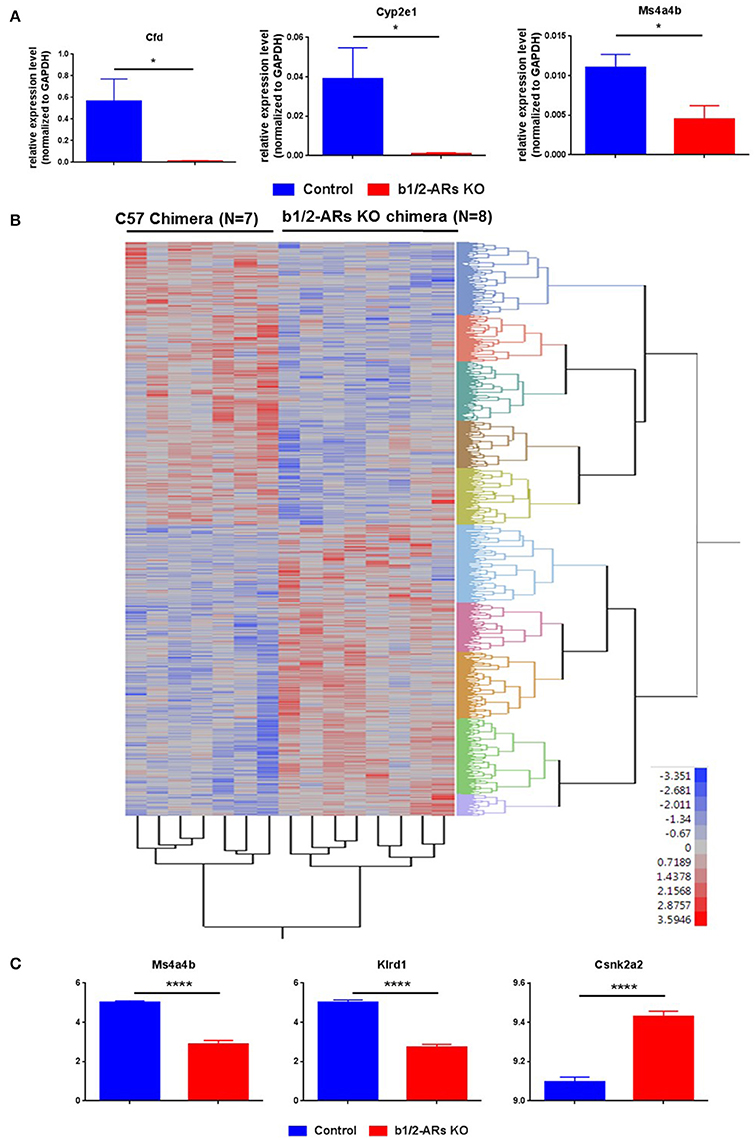
Figure 4. Heatmap of differentially expressed probes between C57 and b1/2-ARs KO chimera.
Heatmap of differentially expressed probes (unadjusted, P < 0.05) between C57 and b1/2-ARs KO chimera. (A) Validation of microarray data by real time PCR. Three genes were selected for validation of microarray analyses. Bar graph shows relative expression level of gene normalized to GAPDH expression. (B) There was a clear distinction between all individuals from each group, with two expression clades evident. (C) The three transcripts with the most significant differences between two groups in the microarray analyses are identified as Klrd1, Ms4a4b and Csnk2a2, presented in the bar graph. Two tailed unpaired t-test analysis indicates ****P < 0.0001. Adjusted P-values are 0.0042, 0.0085, and 0.0216, respectively. *indicated unpaired t-test P < 0.05.
- Figure 4 (412 KB)
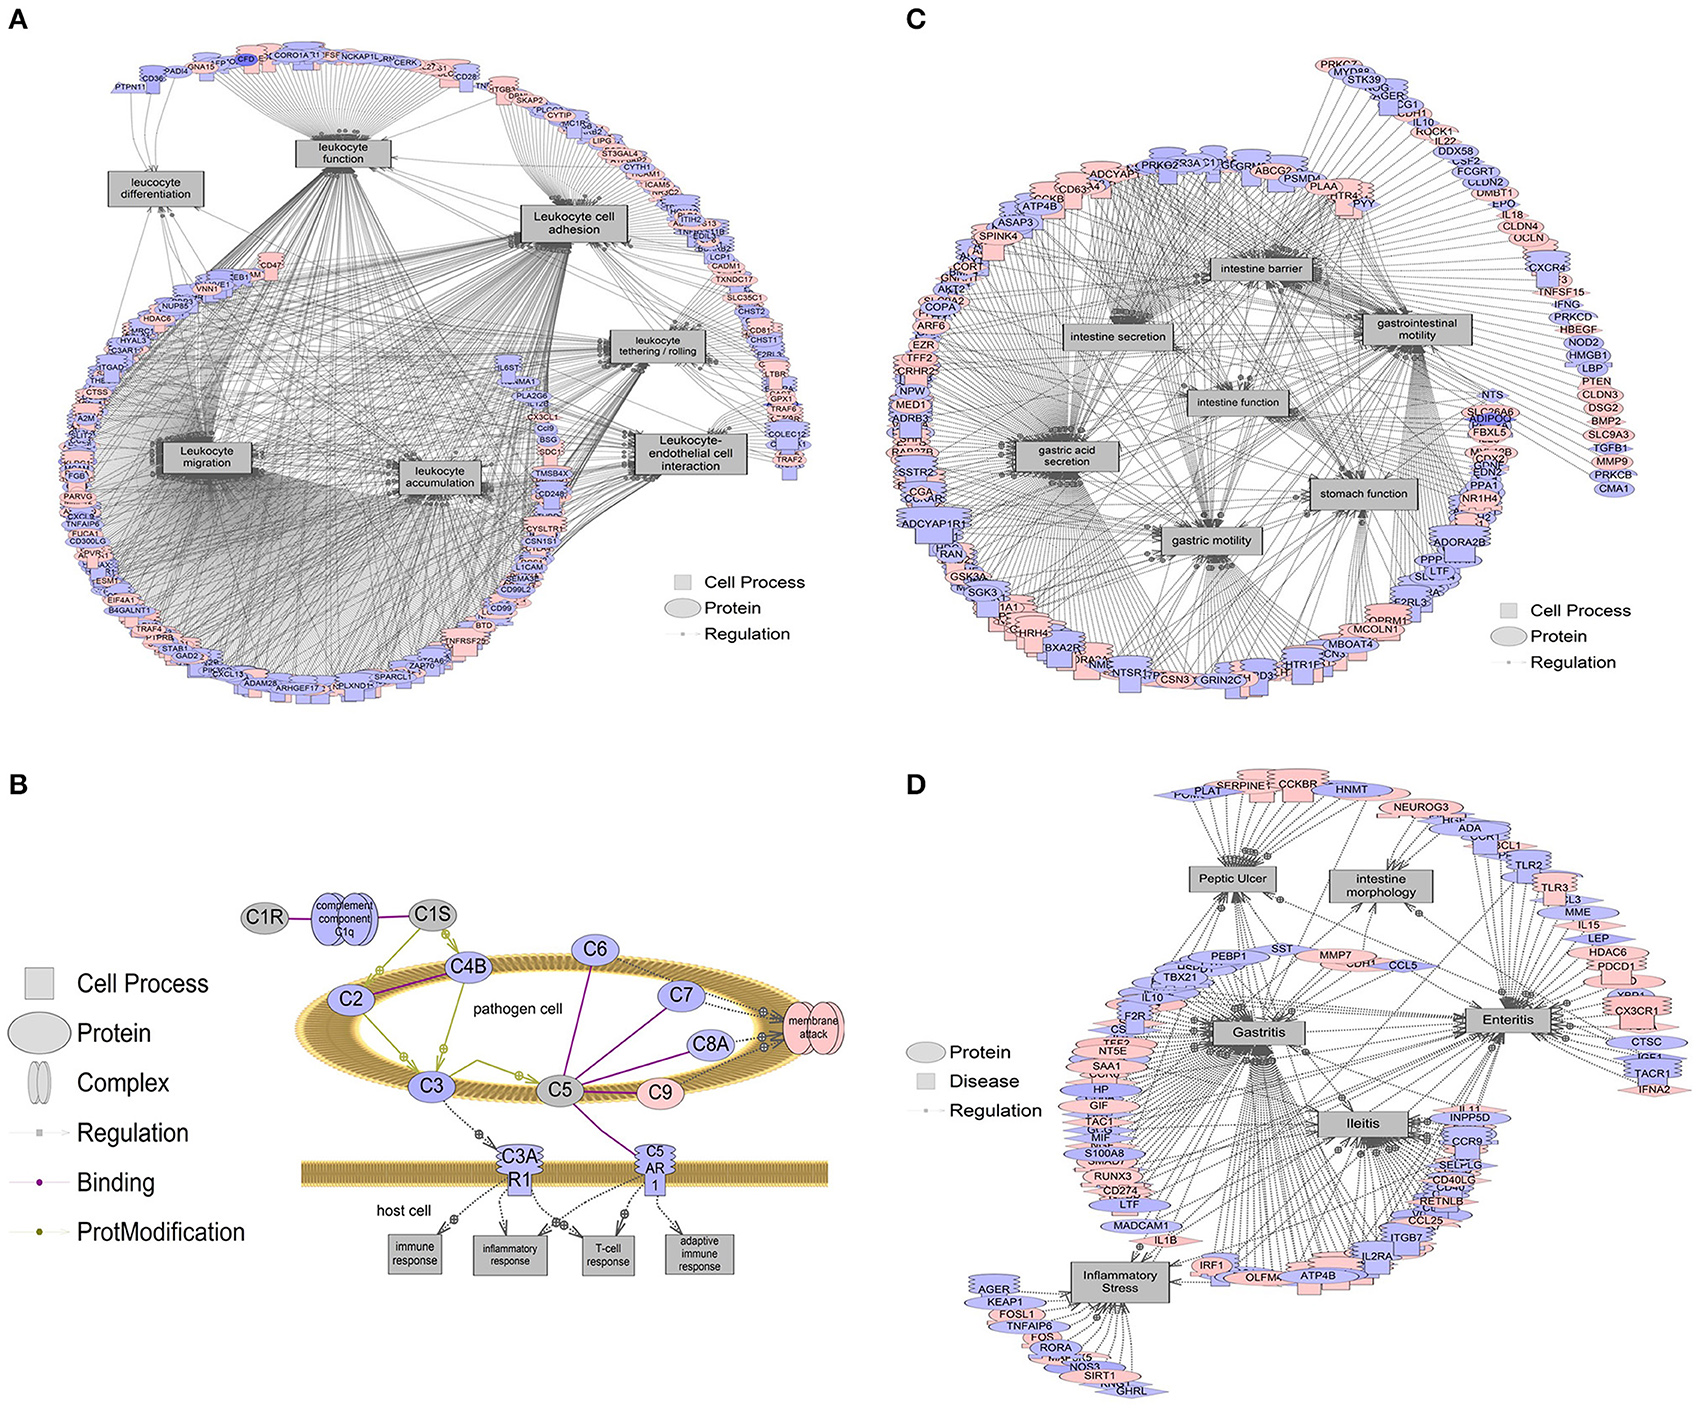
Figure 5. Gene networks associated with intestinal processes and diseases.
Red indicates that relative mRNA levels are increased for the transcript, while blue indicates that relative mRNA levels are decreased for the transcript. The square entities refer to cell processes, the oval entities refer to proteins in general, triangles represent ligands, and receptors are those molecules embedded in the membrane with the mushroom cap. The arrows indicate direction of entity regulation. (A) Gene networks associated with leukocyte functions, including leukocyte adhesion, tethering/rolling, migration, accumulation, differentiation, and interaction with endothelial cells, were all altered. The mean fold change of the entire network is ~10% (1.1-fold). (B) Overall suppression in the classical complement system in the colon of b1/2-ARs KO chimera. The mean fold change of this gene network is ~21% decrease (1.21-fold). (C) Gene networks associated with intestine function, including barrier integrity, secretion, and motility were decreased by 6.5% (1.065-fold). (D) Gene networks associated with intestinal conditions including intestine morphology, enteritis, ileitis, and inflammatory stress are decreased by 7.5% (1.075-fold). Complete data are presented in Appendix 1 and 2. All genes within a pathway are located in Appendix 2.
- Figure 5 (942 KB)
Figure 6. Decreased infiltration of particular IC subsets in the colons of the b1/2-ARs KO chimera.
Significantly lower levels of CD4+ cells (A), CD11b+ macrophages (B) and CD94+ NK cells (C) were observed in the colons of b1/2-ARs KO chimeras compared with C57 control chimeras. Quantified data were presented in the (D). Blue indicates non-specific DAPI staining, while red shows CD4−, CD11b−, and CD94− positive cells, respectively. Images were obtained at 400X magnification. All bars indicate 20 μm. Unpaired two tailed t-test showed ***P < 0.001 and ****P < 0.0001.
- Figure 6 (406 KB)
Tables
Table 1. Primer sequences for microbiota 16S V4–5 amplification.
- Table1 (445 KB)
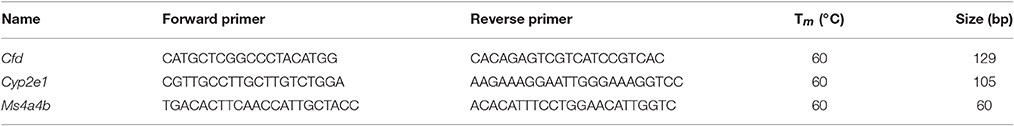
Table 2. Primer sequences for microarray validation.
- Table 2 (65 KB)
Toxicogenomics
Microarray Data
Gene Expression Omnibus (GEO) Series: GSE71632, GPL13912
Raw 16S RNA amplicon sequencing data
NCBI Sequence Read Archive (SRA) database
SRA Submission:
SRP094562
BioProject:
PRJNA355172
BioSample:
SAMN06065847 -
SAMN06065856
Supplemental Materials
Supplementary Material
- Appendix 1. Expression Data (6 MB)
- Appendix 2. Enrichment Analysis (470 KB)