

In vitro Cardiotoxicity Assessment of Environmental Chemicals Using an Organotypic Human Induced Pluripotent Stem Cell-Derived Model
Oksana Sirenko, Fabian A. Grimm, Kristen R. Ryan, Yasuhiro Iwata, Weihsueh A. Chiu, Frederick Parham, Jessica A. Wignall, Blake Anson, Evan F. Cromwell, Mamta Behl, Ivan Rusyn, and Raymond R. Tice.
Toxicology and Applied Pharmacology (2017)
DOI: https://doi.org/10.1016/j.taap.2017.02.020
PMID: 28259702
Publication
Abstract
An important target area for addressing data gaps through in vitro screening is the detection of potential cardiotoxicants. Despite the fact that current conservative estimates relate at least 23% of all cardiovascular disease cases to environmental exposures, the identities of the causative agents remain largely uncharacterized. Here, we evaluate the feasibility of a combinatorial in vitro/in silico screening approach for functional and mechanistic cardiotoxicity profiling of environmental hazards using a library of 69 representative environmental chemicals and drugs. Human induced pluripotent stem cell-derived cardiomyocytes were exposed in concentration-response for 30min or 24h and effects on cardiomyocyte beating and cellular and mitochondrial toxicity were assessed by kinetic measurements of intracellular Ca2+ flux and high-content imaging using the nuclear dye Hoechst 33342, the cell viability marker Calcein AM, and the mitochondrial depolarization probe JC-10. More than half of the tested chemicals exhibited effects on cardiomyocyte beating after 30min of exposure. In contrast, after 24h, effects on cell beating without concomitant cytotoxicity were observed in about one third of the compounds. Concentration-response data for in vitro bioactivity phenotypes visualized using the Toxicological Prioritization Index (ToxPi) showed chemical class-specific clustering of environmental chemicals, including pesticides, flame retardants, and polycyclic aromatic hydrocarbons. For environmental chemicals with human exposure predictions, the activity-to-exposure ratios between modeled blood concentrations and in vitro bioactivity were between one and five orders of magnitude. These findings not only demonstrate that some ubiquitous environmental pollutants might have the potential at high exposure levels to alter cardiomyocyte function, but also indicate similarities in the mechanism of these effects both within and among chemicals and classes.
Figures
Figure 1. Integrative in vitro assessment of cardiotoxicity.
Induced pluripotent stem cell (iPSC)-derived cardiomyocytes were exposed to 69 environmental chemicals and drugs in concentration-response. Chemical effects on cardiomyocyte contractility were determined by intracellular calcium flux measurements after 30 min and 24 h of exposure. Using high-content fluorescence imaging, cellular toxicity was assessed after 30 min and 24 h while mitochondrial toxicity was assessed after 30 min. Phenotypic descriptors were used for quantitative concentration-response assessment and subsequent bioactivity profiling in ToxPi.
- Figure 1 (589 KB)
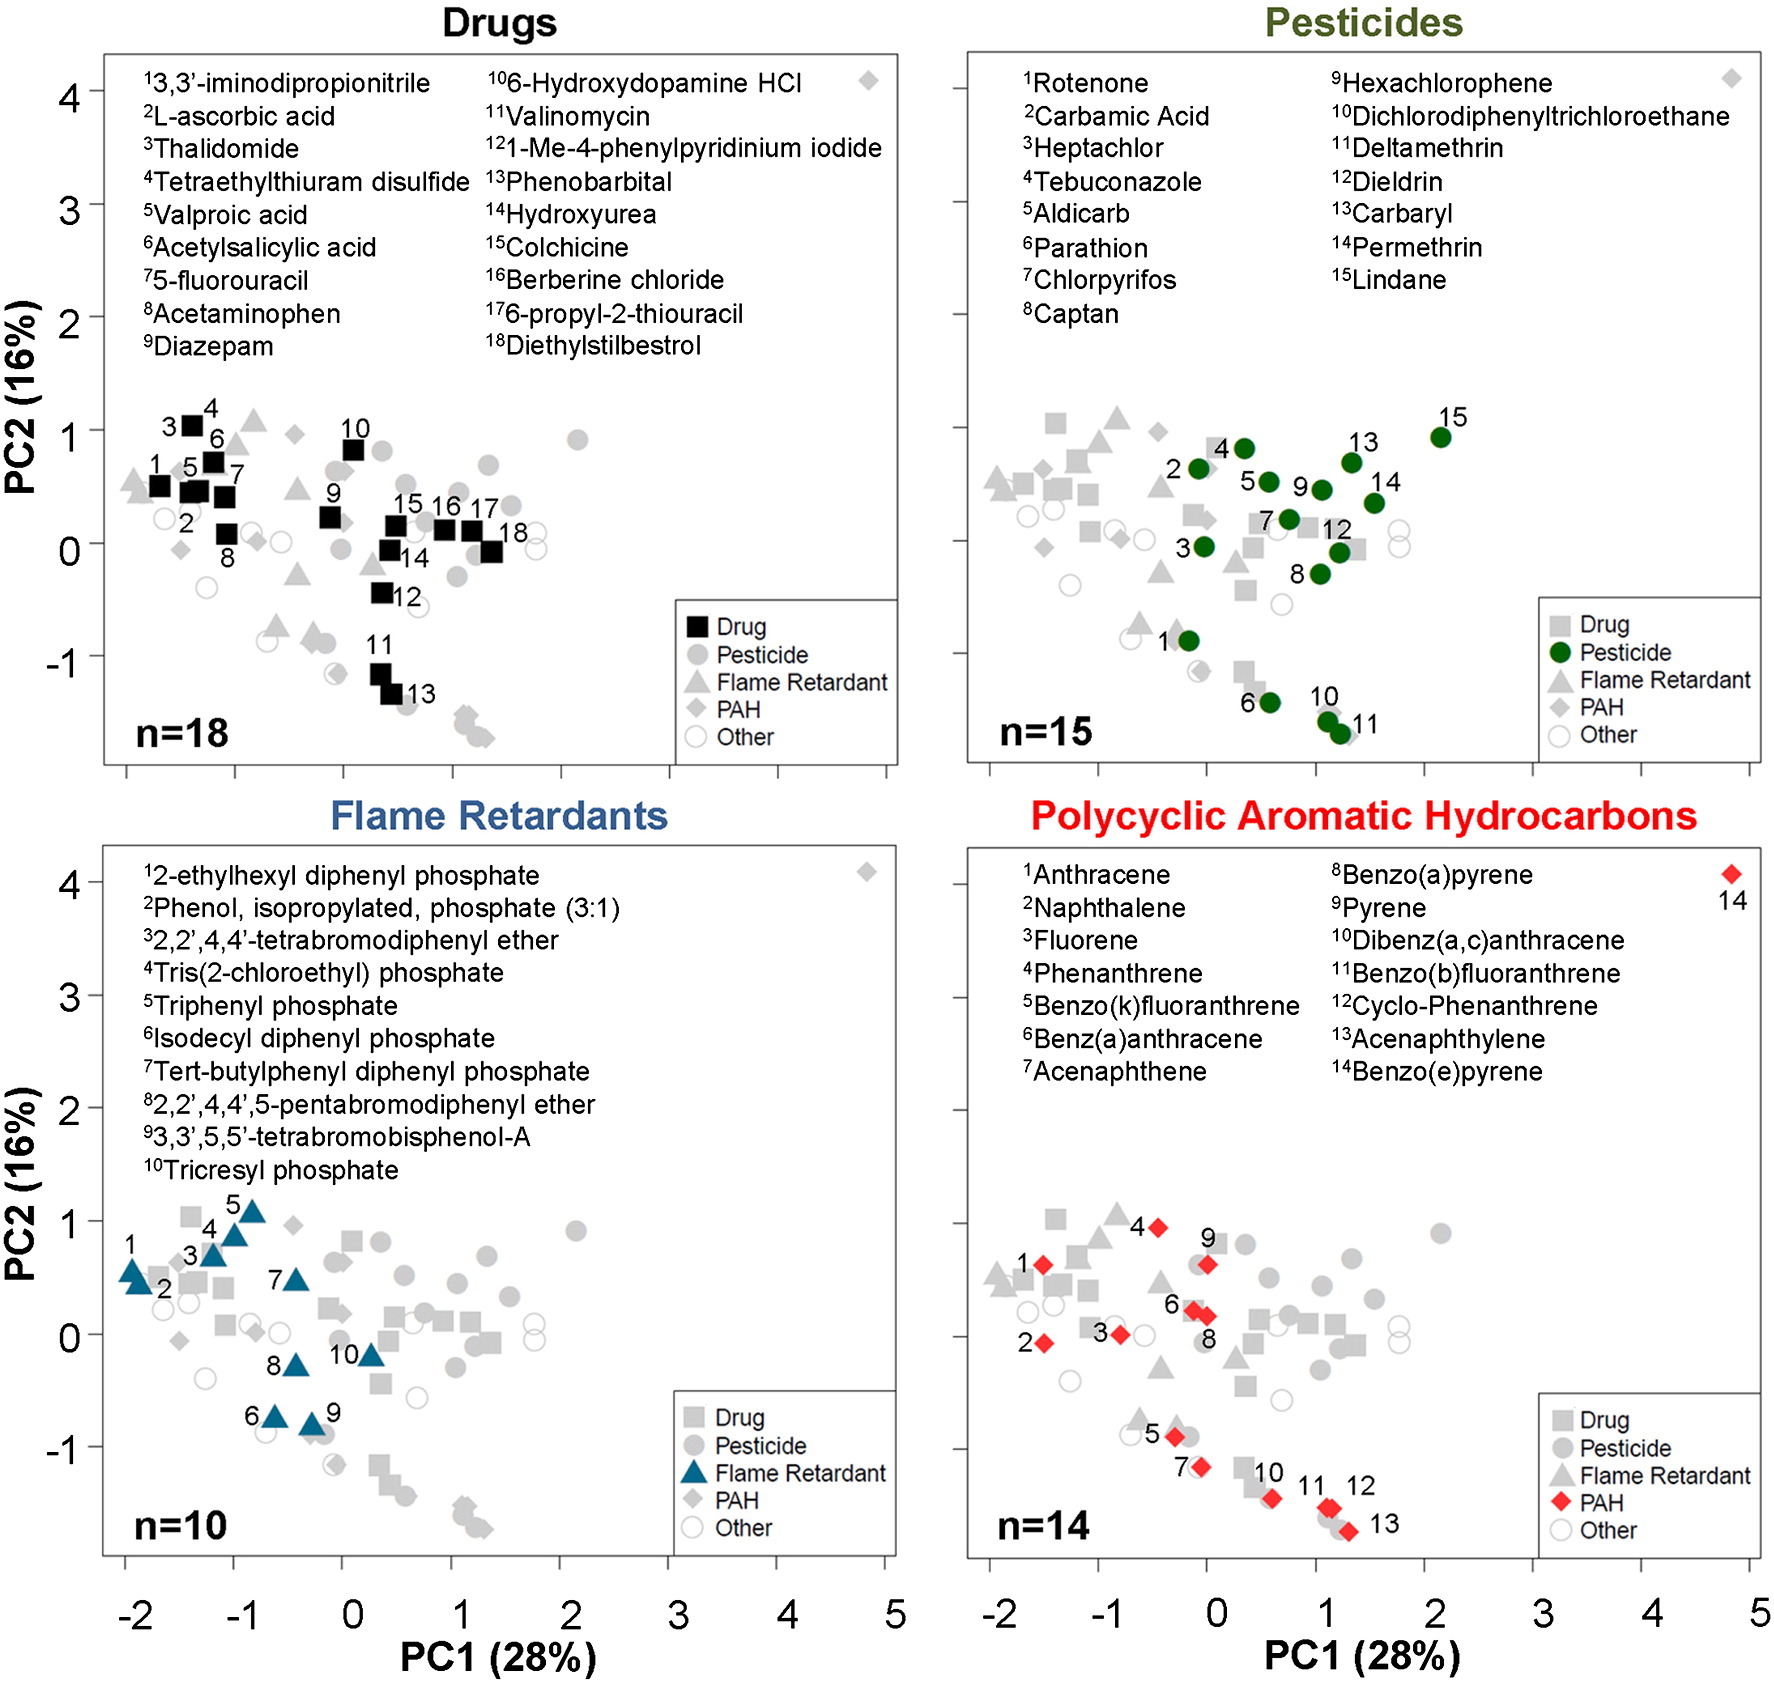
Figure 2. Estimating the chemical diversity using physico-chemical descriptors.
Principal components analysis of 153 physico-chemical descriptors calculated using Chembench web tool (https://chembench.mml.unc.edu/) reveals the chemical diversity of groups of chemicals used in this study. Mapping of the numbers in each panel to chemicals is provided in the inset above each graph.
- Figure 2 (476 KB)
Figure 3. Representative calcium-flux signal traces for different chemical classes.
Shown are typical phenotypic responses including unaffected regular Ca2+-flux (DMSO, biotin) patterns, positive (the pesticide parathion, the flame retardants 2,2′,4,4′-tetrabromodiphenyl ether and 2-ethylhexyl diphenyl phosphate) and negative (the pesticide rotenone) inotropic effects, as well as prolongation of repolarization (the drugs 1-methyl-4-phenylpyridinium iodide and berberine chloride). The two polycyclic aromatic hydrocarbons (PAHs) benzo(e)pyrene and benzo(k)fluoranthene induce mild increases in peak frequency. Biotin, benzo(e)pyrene, benzo(k)fluoranthene traces presented for 30 μM concentrations, other chemicals for 10 μM concentrations after 30 min of exposure. [RFU = relative units of the fluorescence].
- Figure 3 (576 KB)
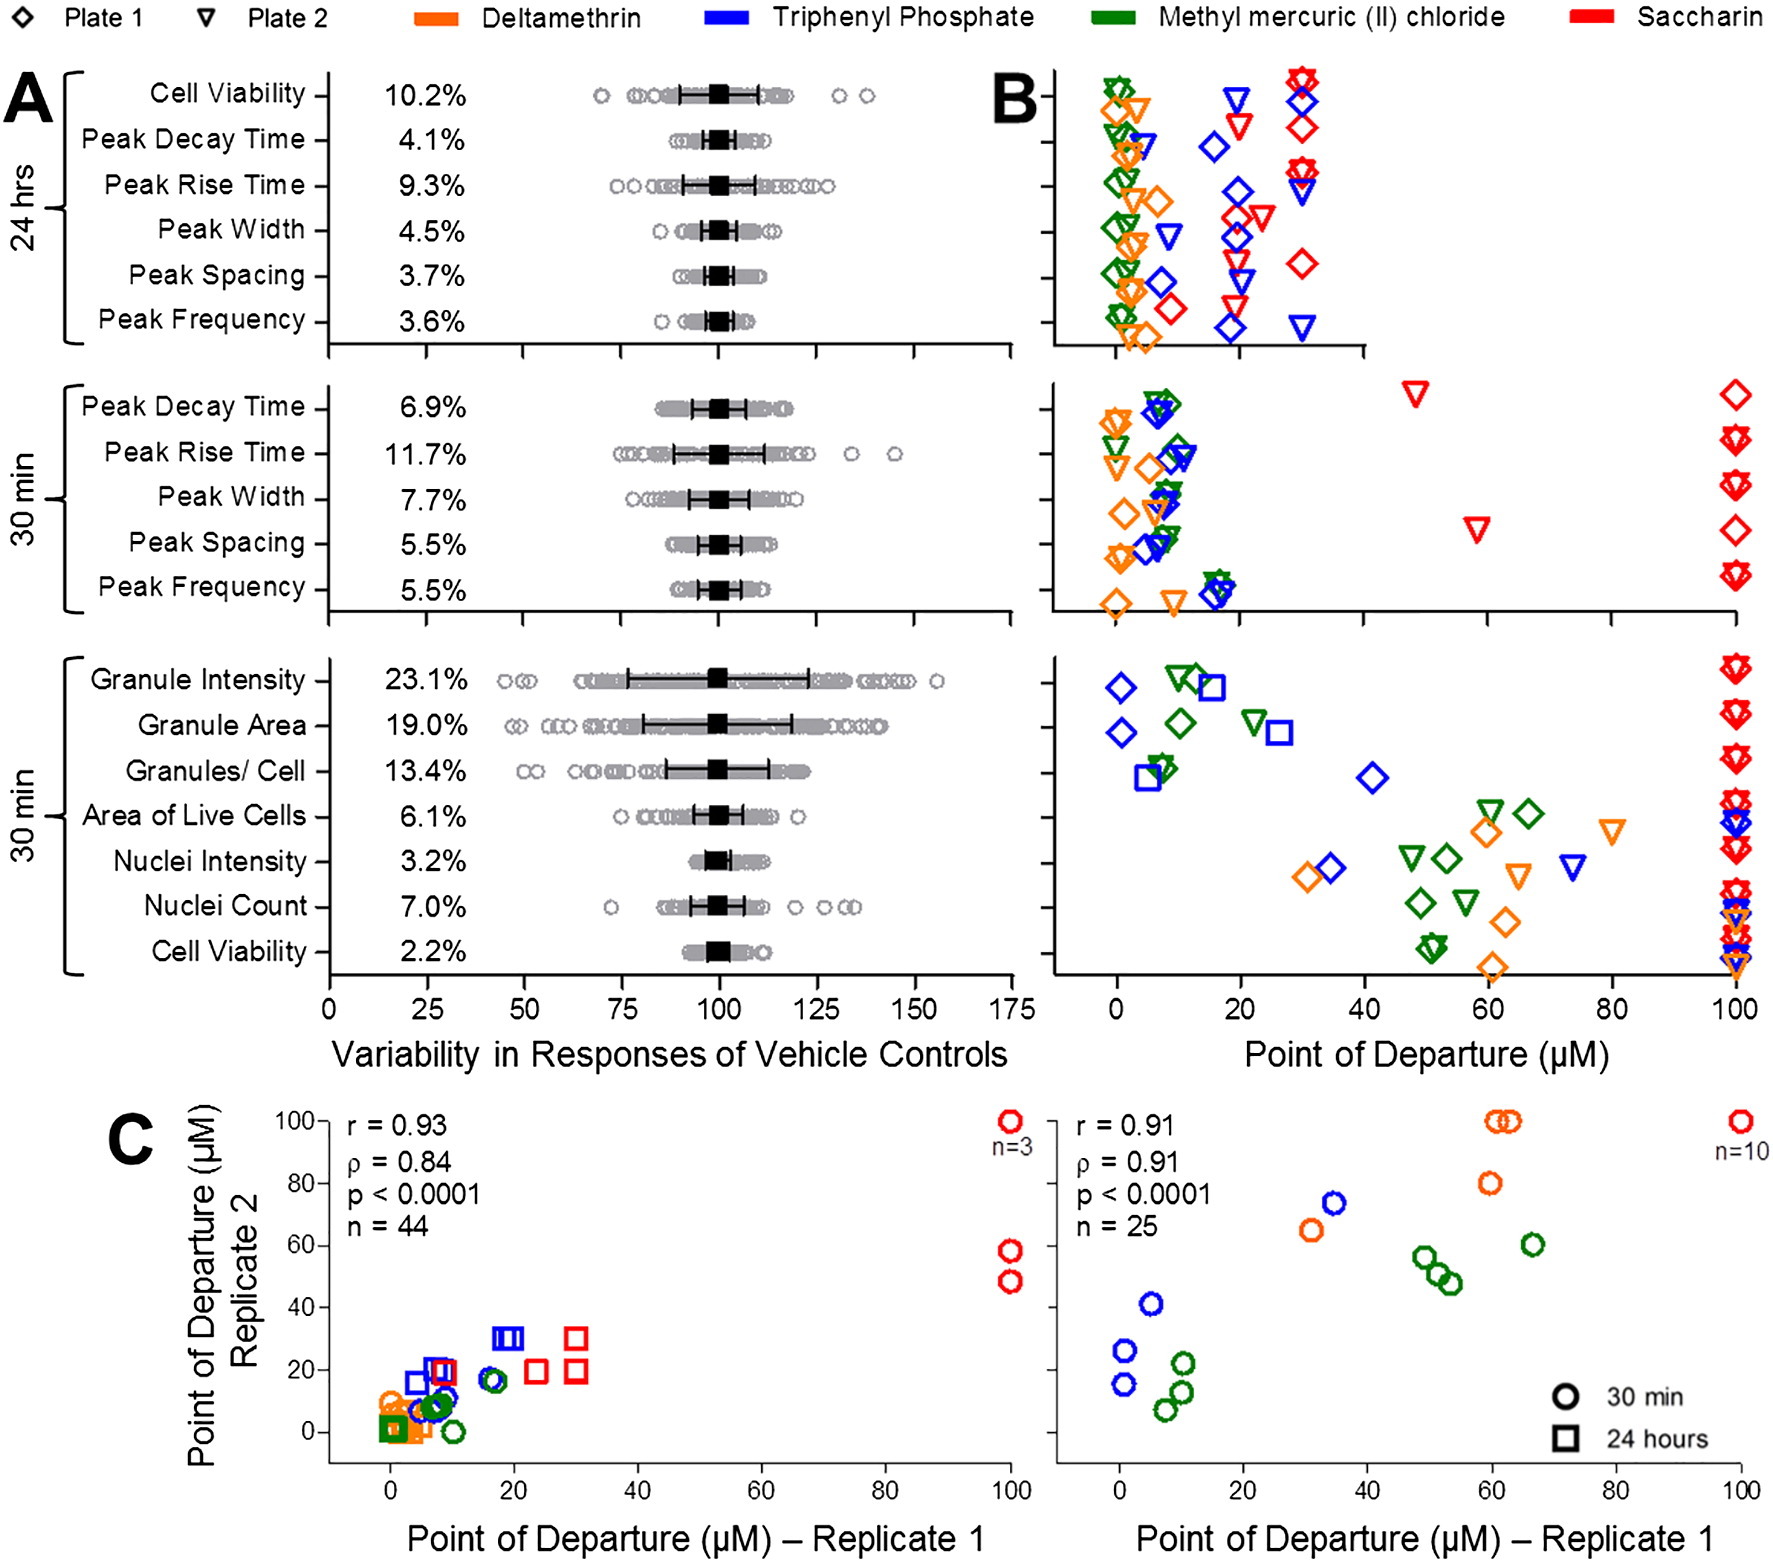
Figure 4. Quality control of in vitro cardiotoxicity, cell viability, and mitochondrial toxicity.
Quality control of in vitro cardiotoxicity, cell viability, and mitochondrial toxicity assays. (A) Vehicle control (DMSO) variability (n = 164 for Cardiophysiology at 30 min; n = 116 for Cardiophysiology at 24 h; n = 144 for Mitochondrial Toxicity). Mean (black square) ± SD (range bars) is shown for each phenotype overlaid on top of gray circles representing individual well responses. Coefficients of variation (%CV) are also shown for each phenotype. (B) Comparison of POD (Point-of-Departure) values from two different assay plates for deltamethrin, triphenyl phosphate, methyl mercuric (II) chloride, and saccharin. Plots indicate replicate PODs for 11 cardiophysiologic (n = 44, including cell viability measurements after 24 h) and 7 cellular and mitochondrial toxicities (n = 25, all after 30 min of chemical exposure) phenotypes. Legend for plate and chemical identifiers is shown above the charts. (C) Correlation between inter-plate replicates for the above defined 11 cardiophysiologic (n = 44, left) and 7 cellular and mitochondrial (n = 25, right) was assessed using Pearson (r) and Spearman (ρ) analysis.
- Figure 4 (409 KB)
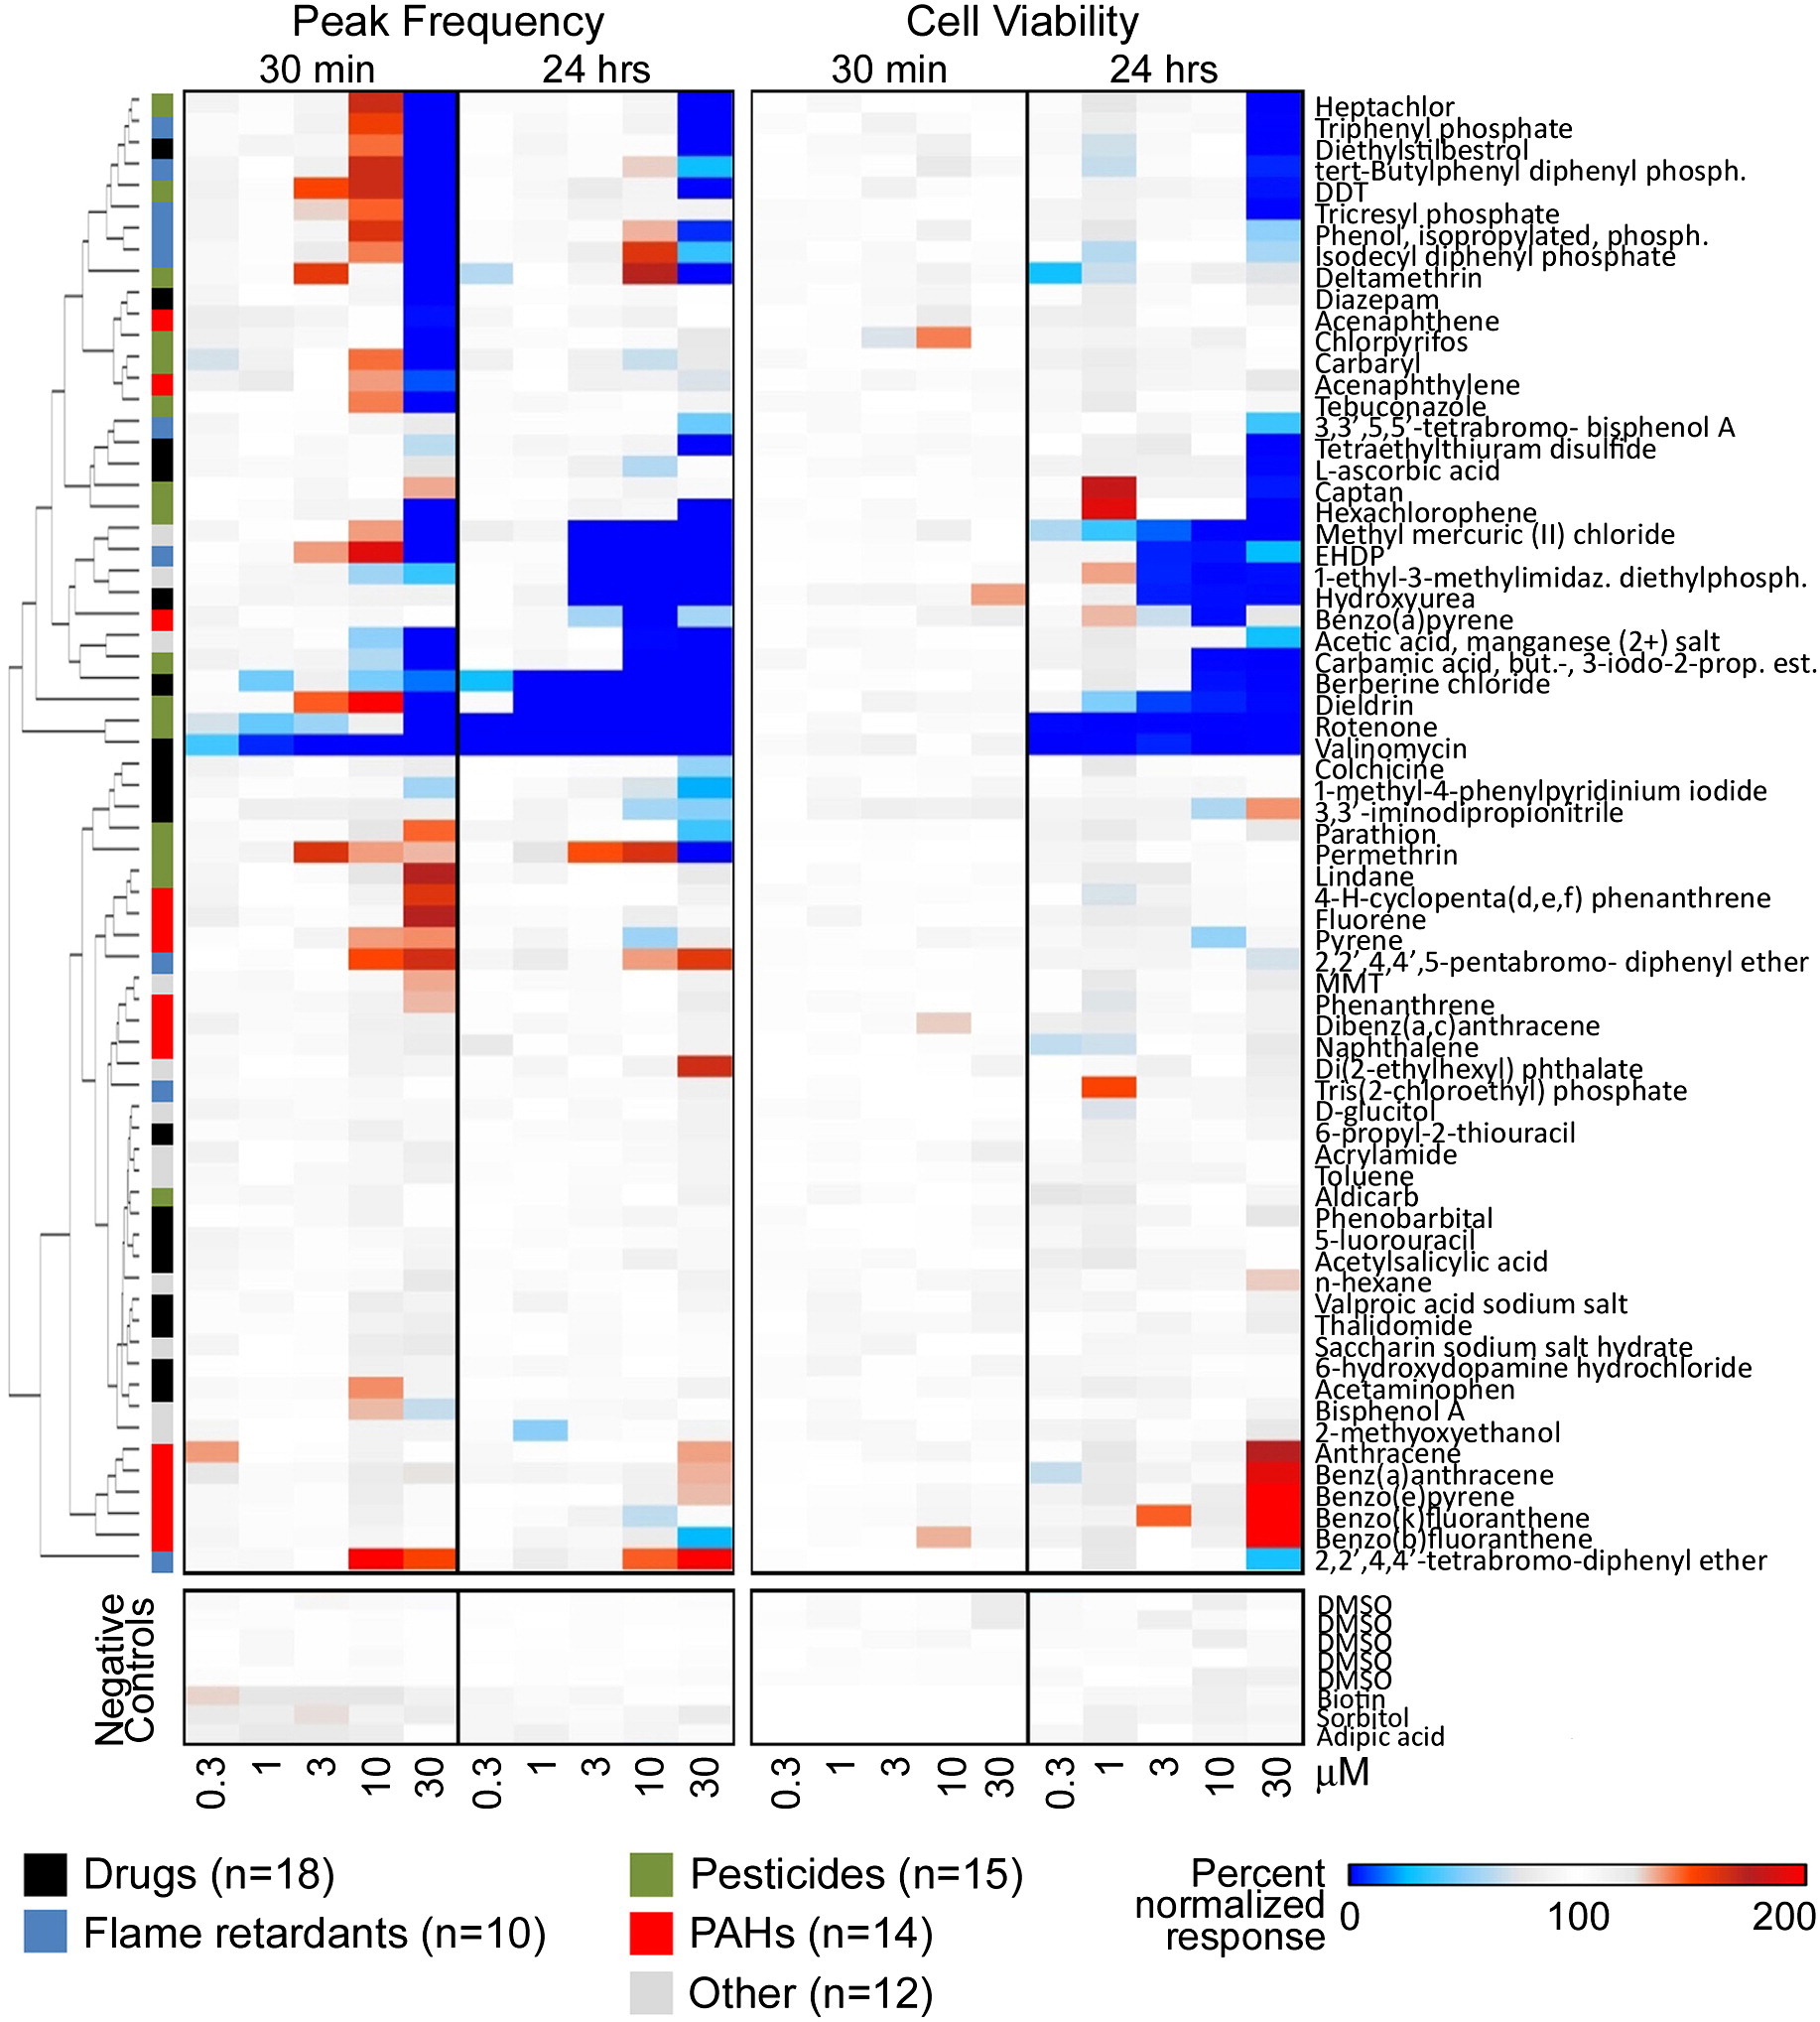
Figure 5. Cluster analysis of quantitative concentration-response data.
Cluster analysis of quantitative concentration-response data for cardiomyocyte peak frequency and cell viability (0.3–30 μM data are shown). Responses at each time point and concentration are shown as a heat map (legend in the bottom of the figure). Chemical classes are also indicated by the colors next to the dendrogram. Full chemical names are indicated in Table 1 and Supplementary Table 1.
- Figure 5 (600 KB)
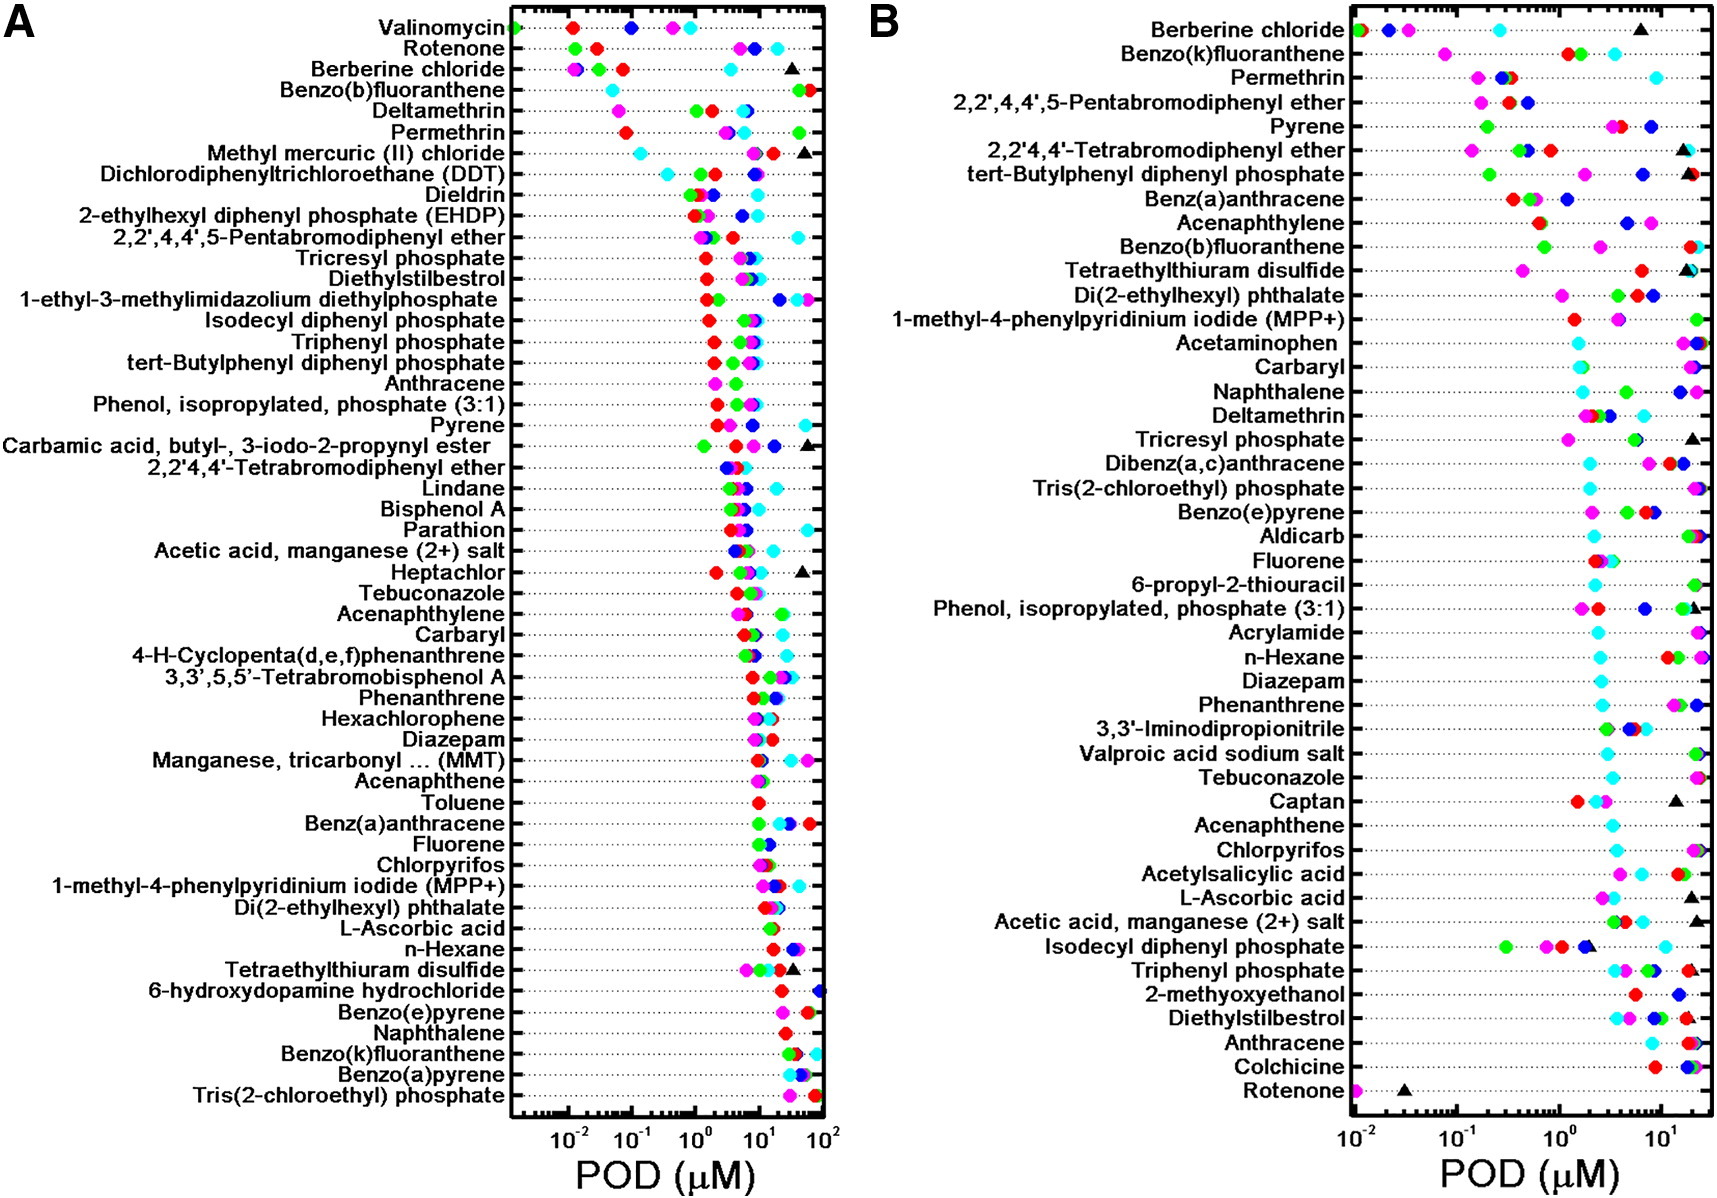
Figure 6. Ranking of selective chemicals.
A. Ranking of the 52 selective chemicals (i.e., chemicals with a PODcell viability/PODCa2+ flux phenotype ratio ≥ 3) at 30 min by the greatest selectivity score (most selective compound on the top). Key: red circle = peak frequency; green circle = peak spacing; blue circle = peak width; cyan circle = peak rise time, magenta circle = peak decay time; black triangle = cell viability based on a decrease in Calcein AM signal. POD = point-of-departure concentrations.
B. Ranking of the 45 selective chemicals (i.e., chemicals with a PODcell viability/PODCa2+ flux phenotype ratio ≥ 3) at 24 h by the greatest selectivity score (most selective compound on the top). Key: red circle = peak frequency; green circle = peak spacing; blue circle = peak width; cyan circle = peak rise time, magenta circle = peak decay time; black triangle = cell viability based on a decrease in Calcein AM signal. POD = Point-of-Departure concentrations.
- Figure 6 (602 KB)
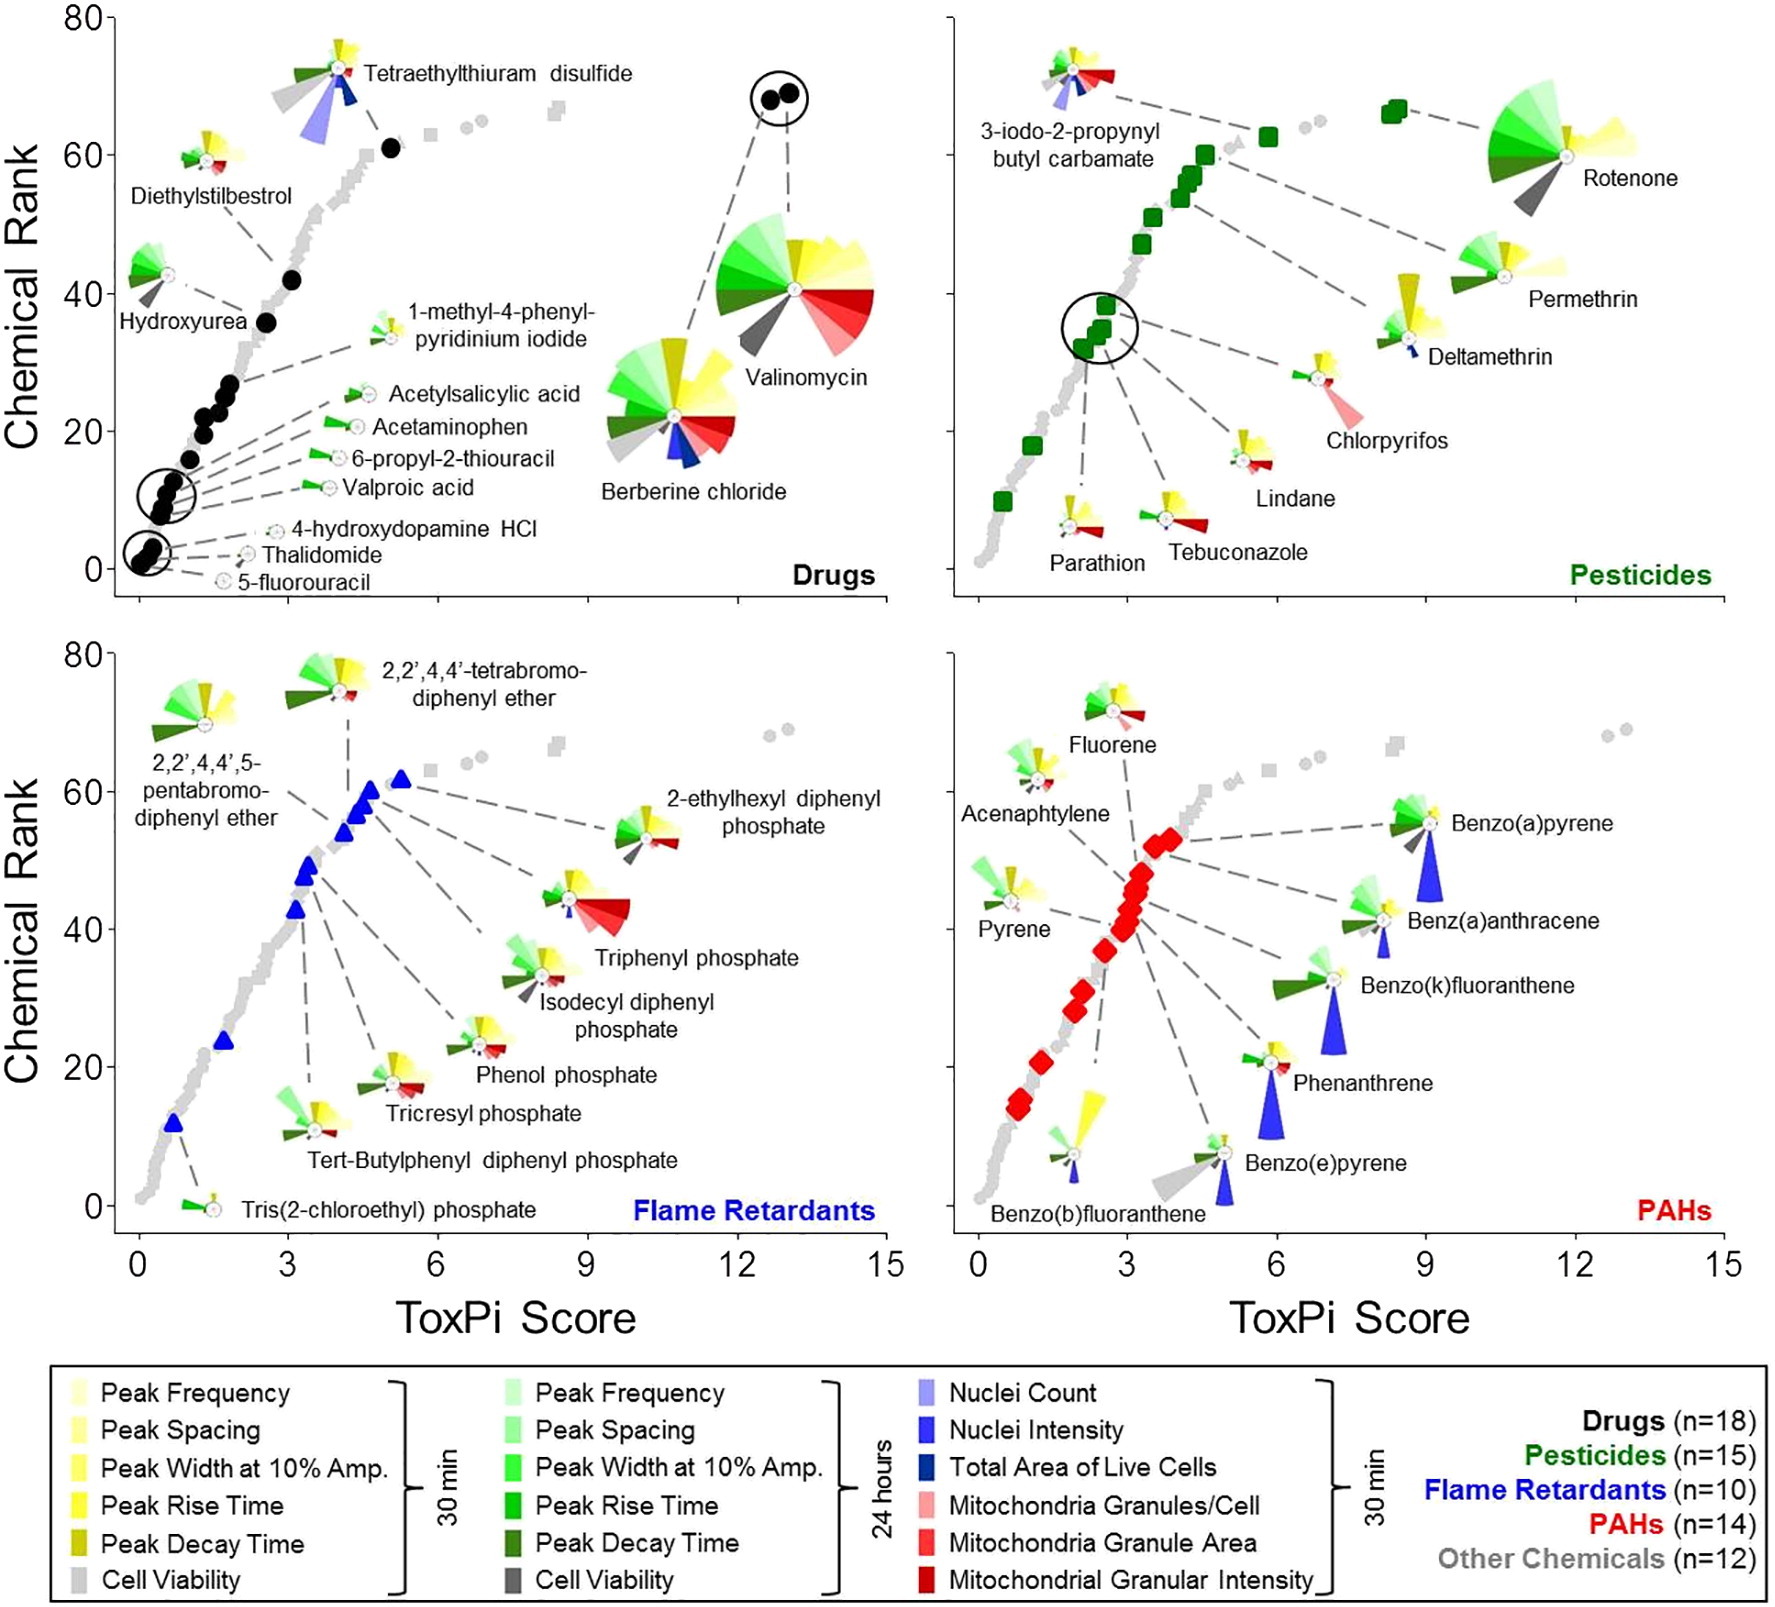
Figure 7. Comprehensive ToxPi analysis of multiparametric cardiotoxicity assessment.
POD (Point-of-Departure) values for 69 unique chemicals that were assessed for both cardiophysiology (10 phenotypes) and cellular/mitochondrial toxicity (8 phenotypes) were integrated in ToxPi software for quantitative bioactivity profiling. Plots indicate relative chemical rankings per chemical class. ToxPi profiles for selected representative chemicals are indicated.
- Figure 7 (432 KB)
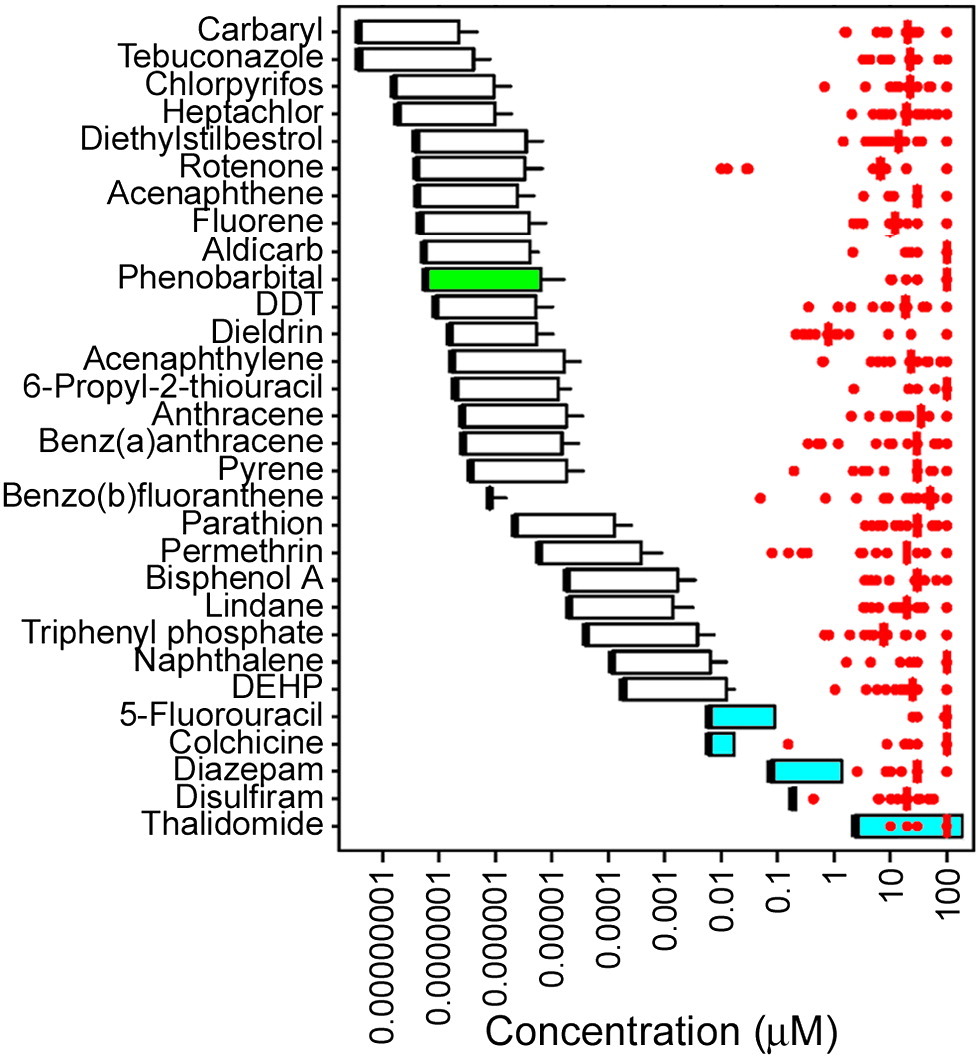
Figure 8. Comparison of POD (Point-of-Departure) values.
Comparison of POD (Point-of-Departure) values for in vitro cardiotoxicity, cell viability, and mitochondrial toxicity assays (red dots are individual values, red vertical bar is the median) and human blood concentration estimates (box and whisker). Blood concentration ranges for the chemicals shown were derived as detailed in Methods. Thick black line is the predicted blood concentration at median exposure assuming median toxicokinetics. Upper bound of the box is predicted blood concentration at the 95th percentile for exposure assuming median toxicokinetics. Whisker is predicted blood concentration at the 95th percentile for exposure assuming 95th percentile of toxicokinetics. White box and whisker graphs are for chemicals with the blood concentrations at steady state values as reported in Wetmore et al. (2015). Green box and whisker graphs are for chemicals with the blood concentrations at steady state values calculated using a 3 compartment model implemented by Pearce et al. (2017). Blue box and whisker graphs are for drugs with reported Cmax ranges from human clinical trials. Chemicals are shown that had both human blood concentration estimates and POD values for all in vitro phenotypes.
- Figure 8 (233 KB)
Tables
Table 1. List of chemicals used for phenotypic screening.
- Table 1 (202 KB)