

Neurite Outgrowth in Human Induced Pluripotent Stem Cell-Derived Neurons as A High-Throughput Screen for Developmental Neurotoxicity or Neurotoxicity
Ryan KR, Sirenko O, Parham F, Hsieh JH, Cromwell EF, Tice RR, Behl M.
Neurotoxicology. 2016
DOI: https://doi.org/10.1016/j.neuro.2016.02.003
PMID: 26854185
Publication
Abstract
Due to the increasing prevalence of neurological disorders and the large number of untested compounds in the environment, there is a need to develop reliable and efficient screening tools to identify environmental chemicals that could potentially affect neurological development. Herein, we report on a library of 80 compounds screened for their ability to inhibit neurite outgrowth, a process by which compounds may elicit developmental neurotoxicity, in a high-throughput, high-content assay using human neurons derived from induced pluripotent stem cells (iPSC). The library contains a diverse set of compounds including those that have been known to be associated with developmental neurotoxicity (DNT) and/or neurotoxicity (NT), environmental compounds with unknown neurotoxic potential (e.g., polycyclic aromatic hydrocarbons (PAHs) and flame retardants (FRs)), as well as compounds with no documented neurotoxic potential. Neurons were treated for 72 h across a 6-point concentration range (∼0.3–100 μM) in 384-well plates. Effects on neurite outgrowth were assessed by quantifying total outgrowth, branches, and processes. We also assessed the number ofviable cells per well. Concentration-response profiles were evaluated using a Hill model to derive benchmark concentration (BMC) values. Assay performance was evaluated using positive and negative controls and test replicates. Compounds were ranked by activity and selectivity (i.e., specific effects on neurite outgrowth in the absence of concomitant cytotoxicity) and repeat studies were conducted to confirm selectivity. Among the 80 compounds tested, 38 compounds were active, of which 16 selectively inhibited neurite outgrowth. Of these 16 compounds, 12 were known to cause DNT/NT and the remaining 4 compounds included 3 PAHs and 1 FR. In independent repeat studies, 14/16 selective compounds were reproducibly active in the assay, of which only 6 were selective for inhibition of neurite outgrowth. These 6 compounds were previously shown in the literature to be neurotoxic. These studies shed light on the current status of human iPSCs in DNT/NT screening and their utility in identifying, ranking, and prioritizing compounds with DNT/NT potential for further in vivo testing.
Figures
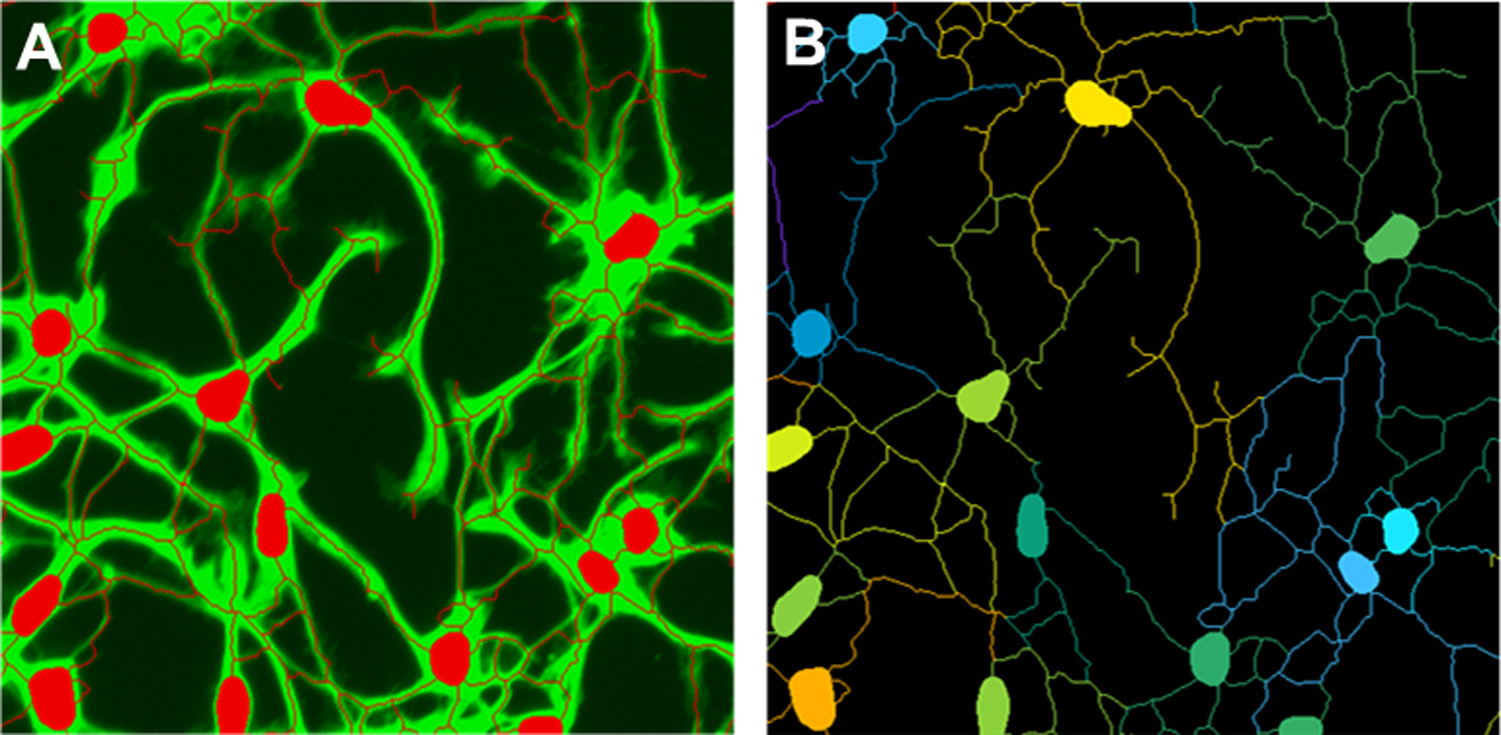
Figure 1. High-content imaging of human iPSC neurons.
(A) Representative fluorescence microscopy image (zoomed) showing the automated identification of neuronal bodies (red dots) and outgrowth parameters (thin red lines) from DMSO-treated neurons for 72 h; green fluorescence is Calcien AM staining. (B) Software tracing for the quantification of neuronal bodies and outgrowth parameters using the Neurite Outgrowth module in the MetaXpress 5 software.
- Figure 1 (322 KB)
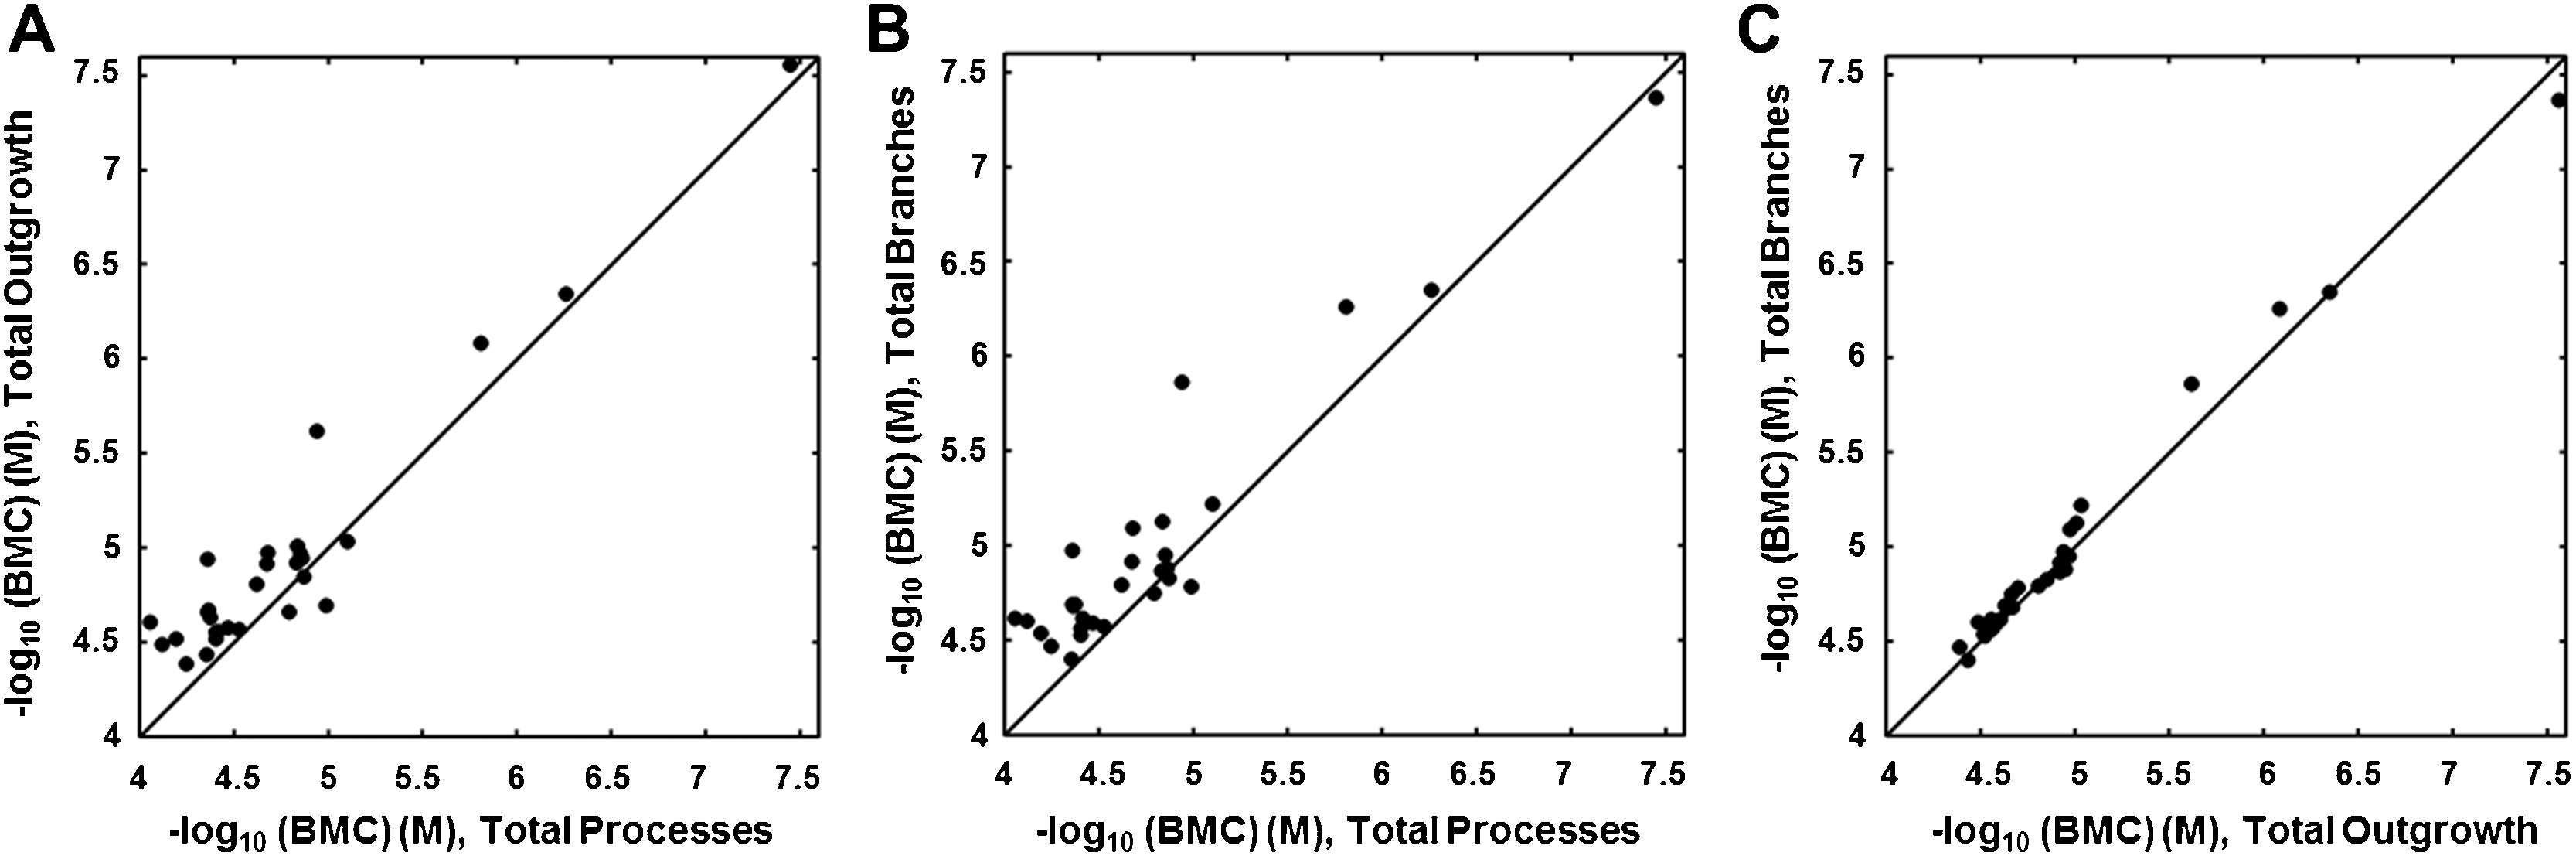
Figure 2. Comparison of endpoints for active compounds in the neurite outgrowth assay.
Scatter plots of −log10(BMC in M) for three neurite outgrowth endpoints, for the 29 compounds with BMCs <100 μM for all three endpoints. (A and B) BMC values for total outgrowth and total branches were lower than BMC values for total processes indicating that these endpoints may be more sensitive for detecting toxicity. (C) Compounds affect total branches and total outgrowth at similar concentrations (based on BMC values).
- Figure 2 (303 KB)
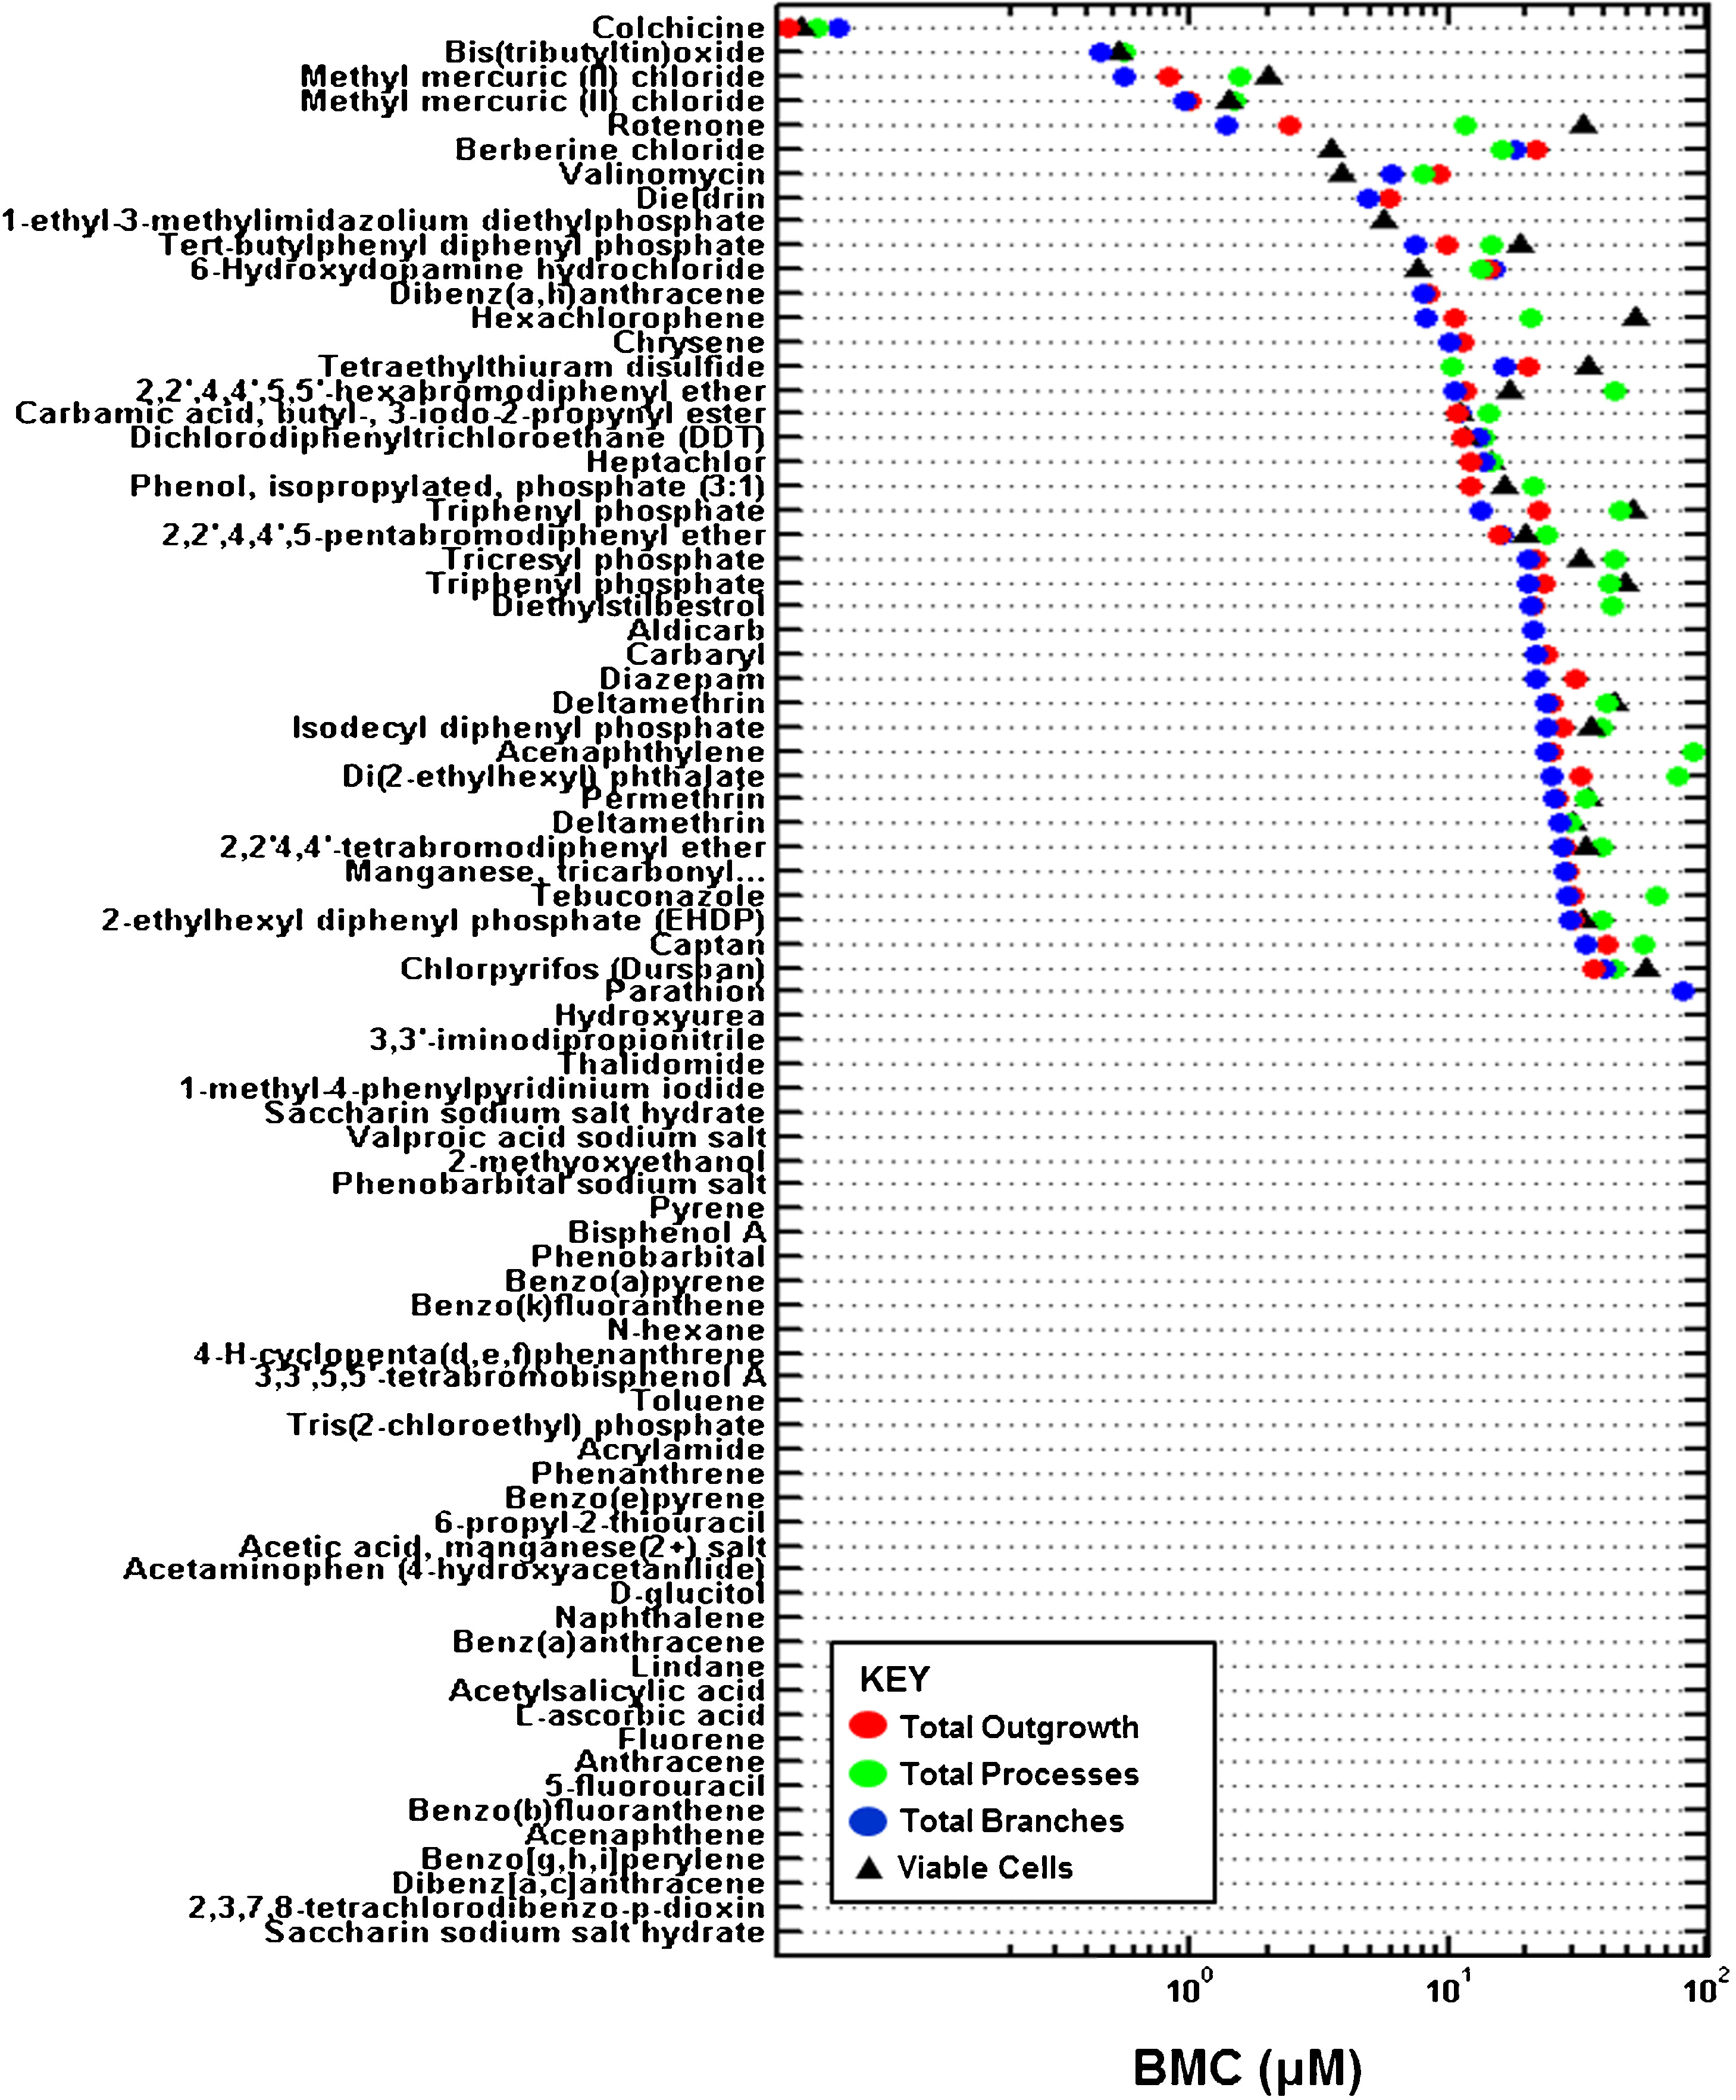
Figure 3. Ranking of the 80 compounds by the most sensitive endpoint BMC.
Ranking of the 80 compounds by the most sensitive endpoint BMC (most potent compound on the top). For all compounds with a BMC value <100 μM, a comparison is shown between the BMC for the each neurite endpoint and the BMC for viability as a marker of cytotoxicity. For several compounds, the BMC was not estimated because no effect was observed over the concentration range tested, x-axis (0.3–100 μM). Key: red circle = total outgrowth; green circle = total processes; blue circle = total branches; black triangle = viable cells. BMC = benchmark concentration.
- Figure 3 (2 MB)
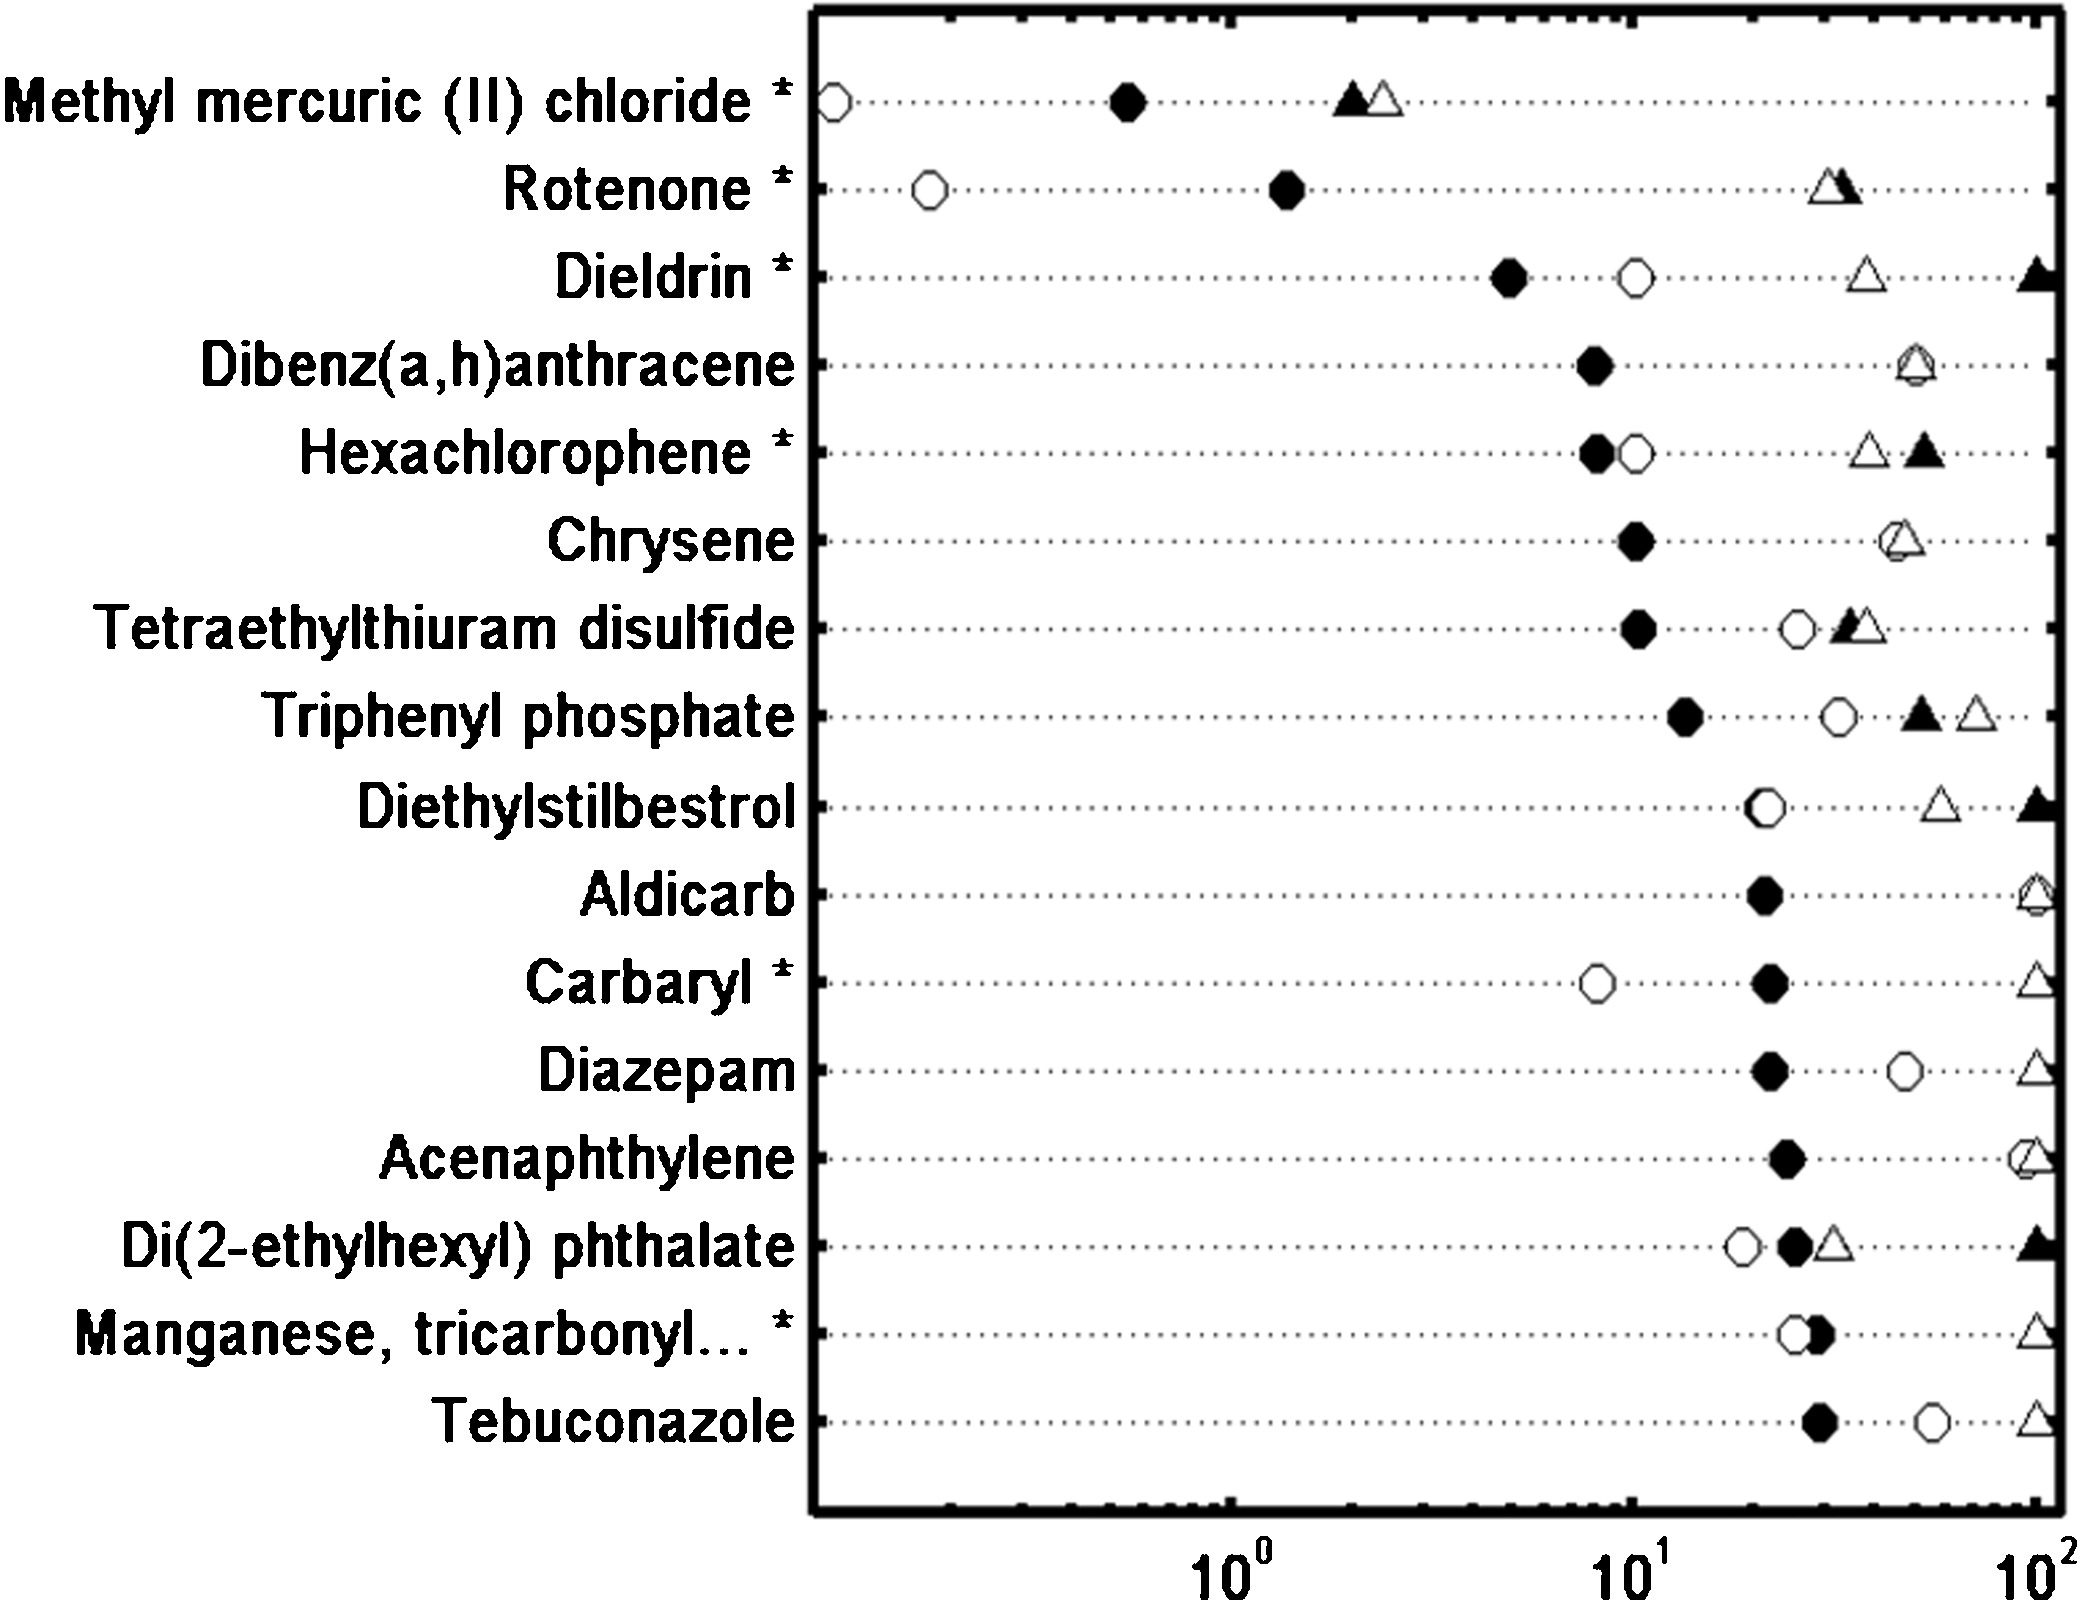
Figure 4. Comparison of compounds in screening and repeat studies.
The 16 selective compounds from the screening study are ranked by most potent (top) to least (bottom) based estimated BMC values (filled circle) for the most sensitive neurite endpoint (e.g., total outgrowth, branches, or processes). Corresponding BMC values for viable cells (cytotoxicity) are noted by filled triangles. Similar data is plotted for the repeat study for each compound: open circles represents the BMC for the neurite endpoint and the open triangle is the corresponding BMC for viable cells. Compounds which were selective in both assays (SS is ≥0.5) have an asterisks (*) next to their name on the y-axis.
- Figure 4 (380 KB)
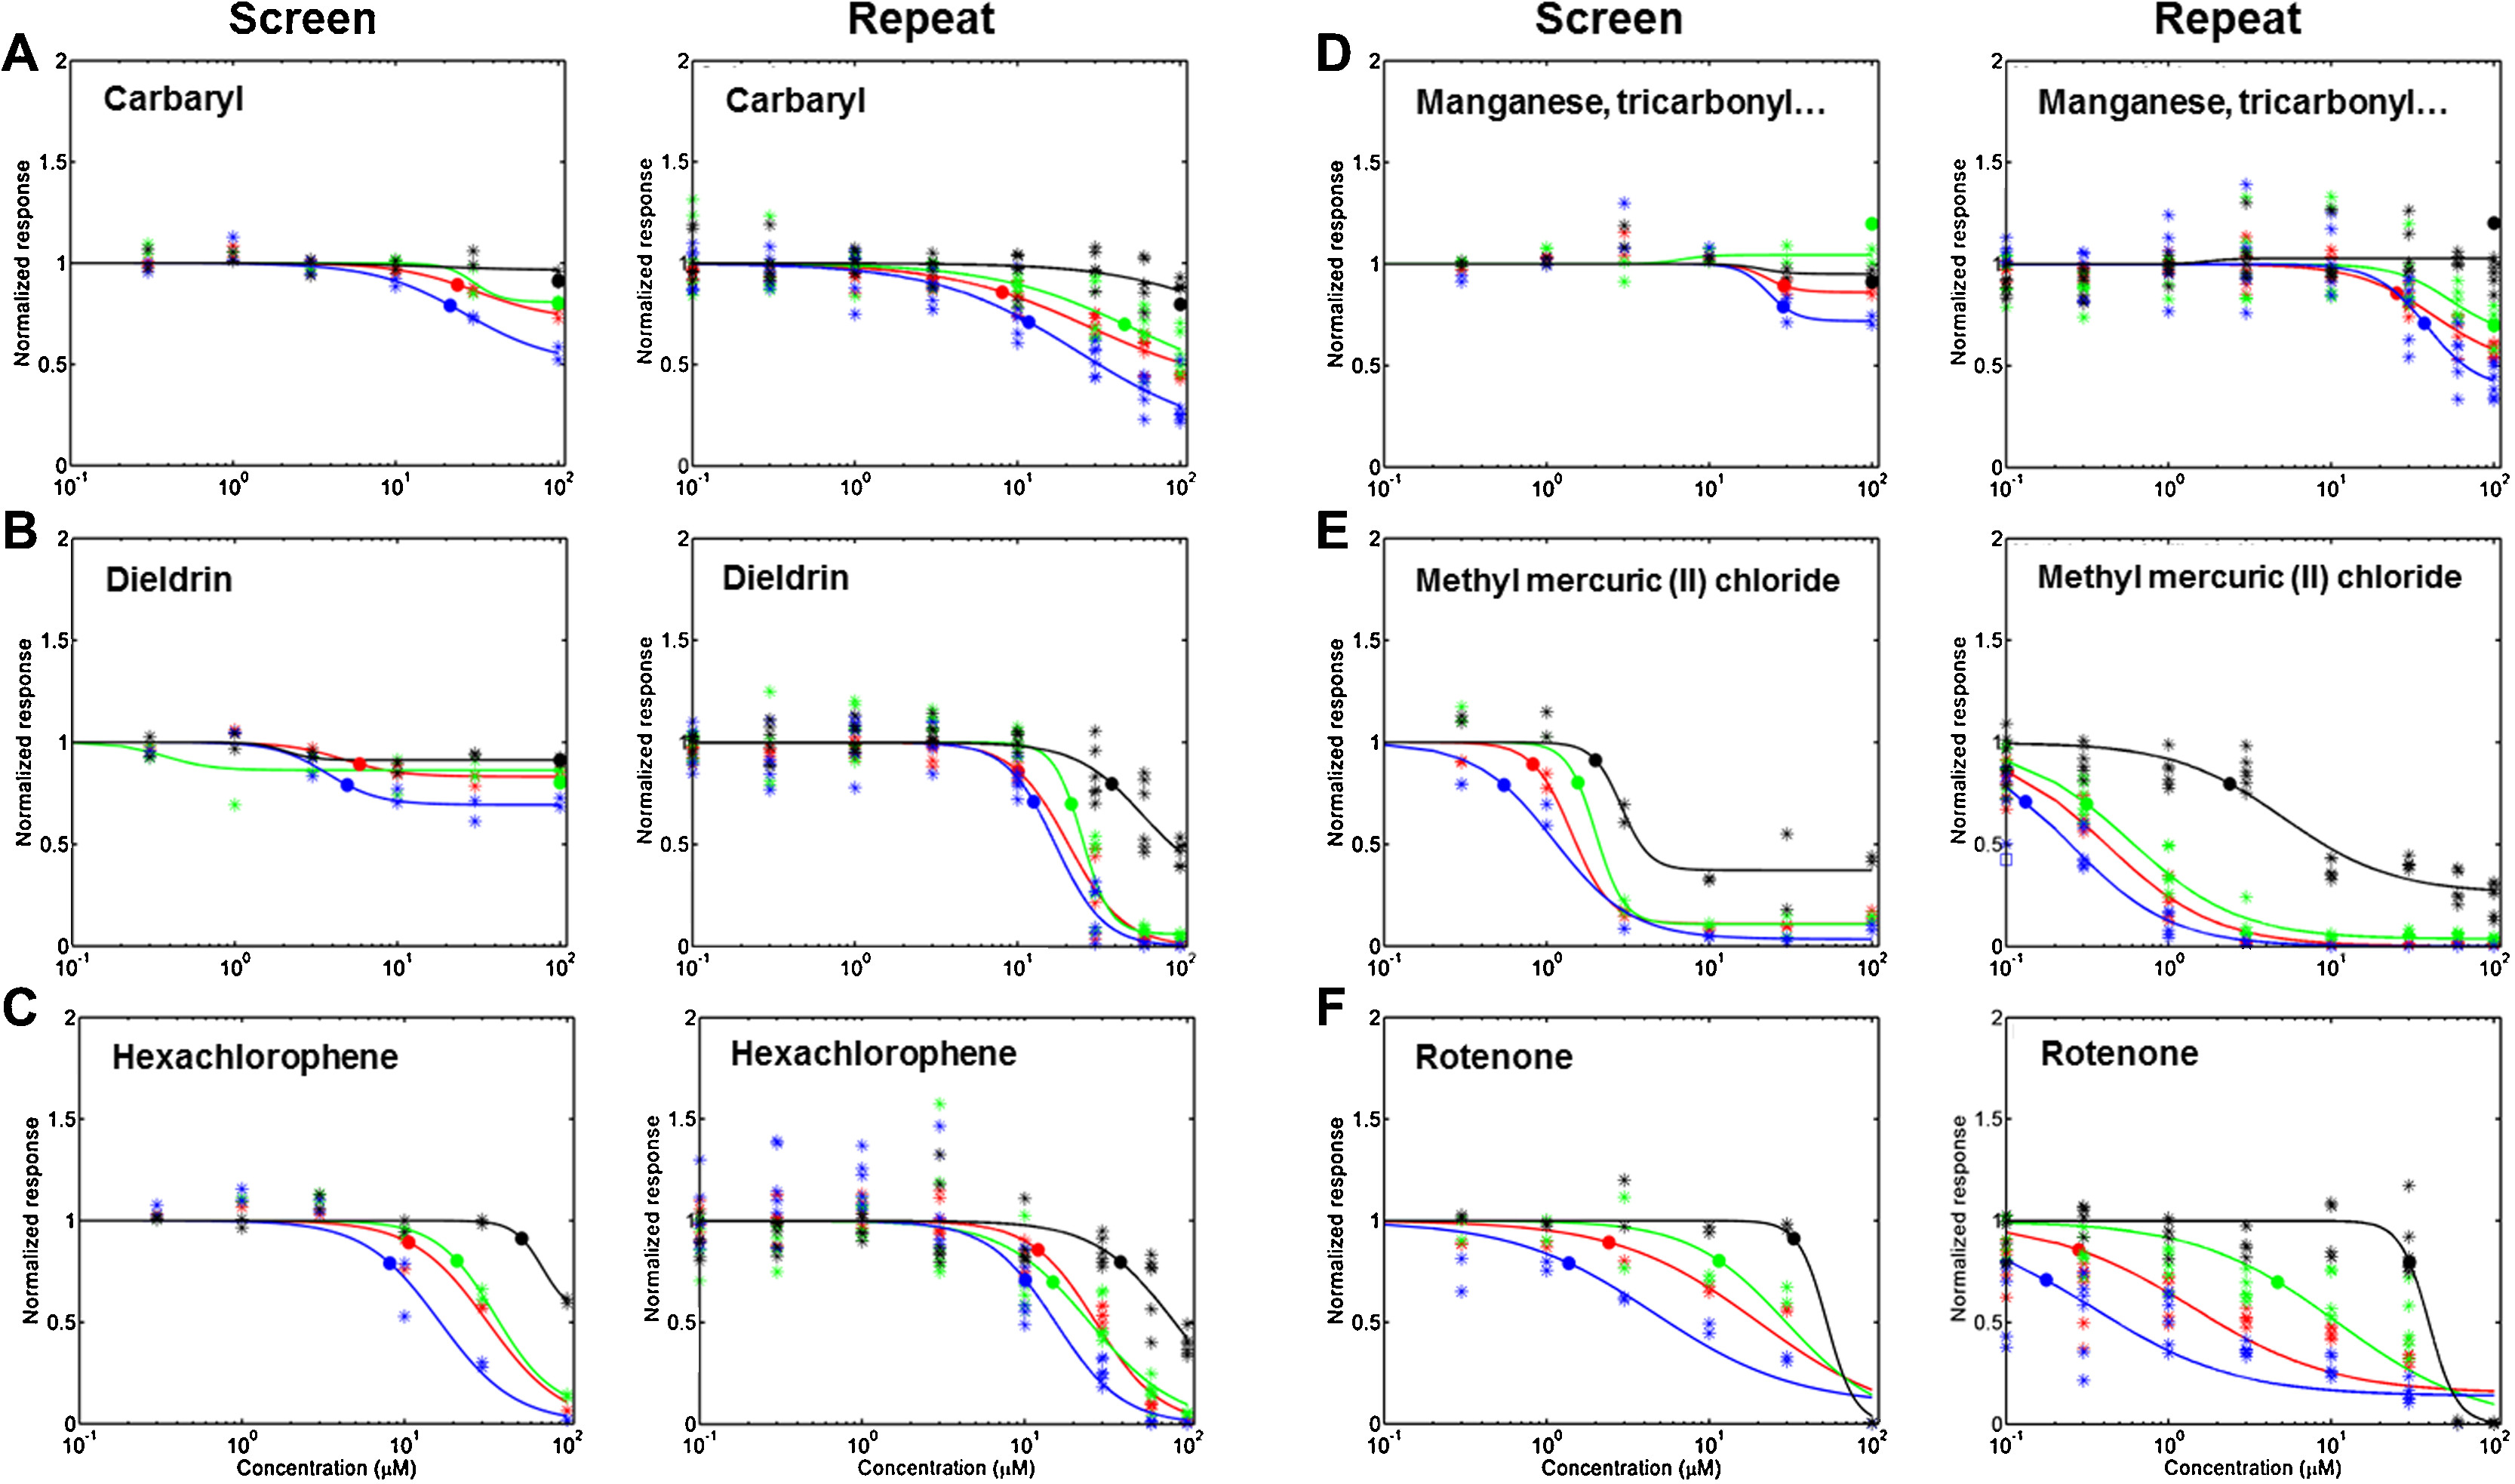
Figure 5. Concentration response modeling for compounds.
Concentration response modeling for compounds which were reproducibly selective among the screen and repeat studies: (A) carbaryl, (B) dieldrin, (C) hexachlorophene, (D) manganese, tricarbonyl[(1,2,3,4,5-.eta.)-1-methyl-2,4-cyclopentadien-1-yl]- (MMT), (E) methyl mercuric (II) chloride, and (F) rotenone. For each concentration-response curve, data points (*) and BMCs (●) demonstrate that effects on neurites occur at lower concentrations than effects on cell viability. The y-axis represents the normalized response across the concentration range on the x-axis (0.1–100 μM). BMC = benchmark concentration. Key: red = total outgrowth; green = total processes; blue = total branches; black = viable cells.
- Figure 5 (748 KB)
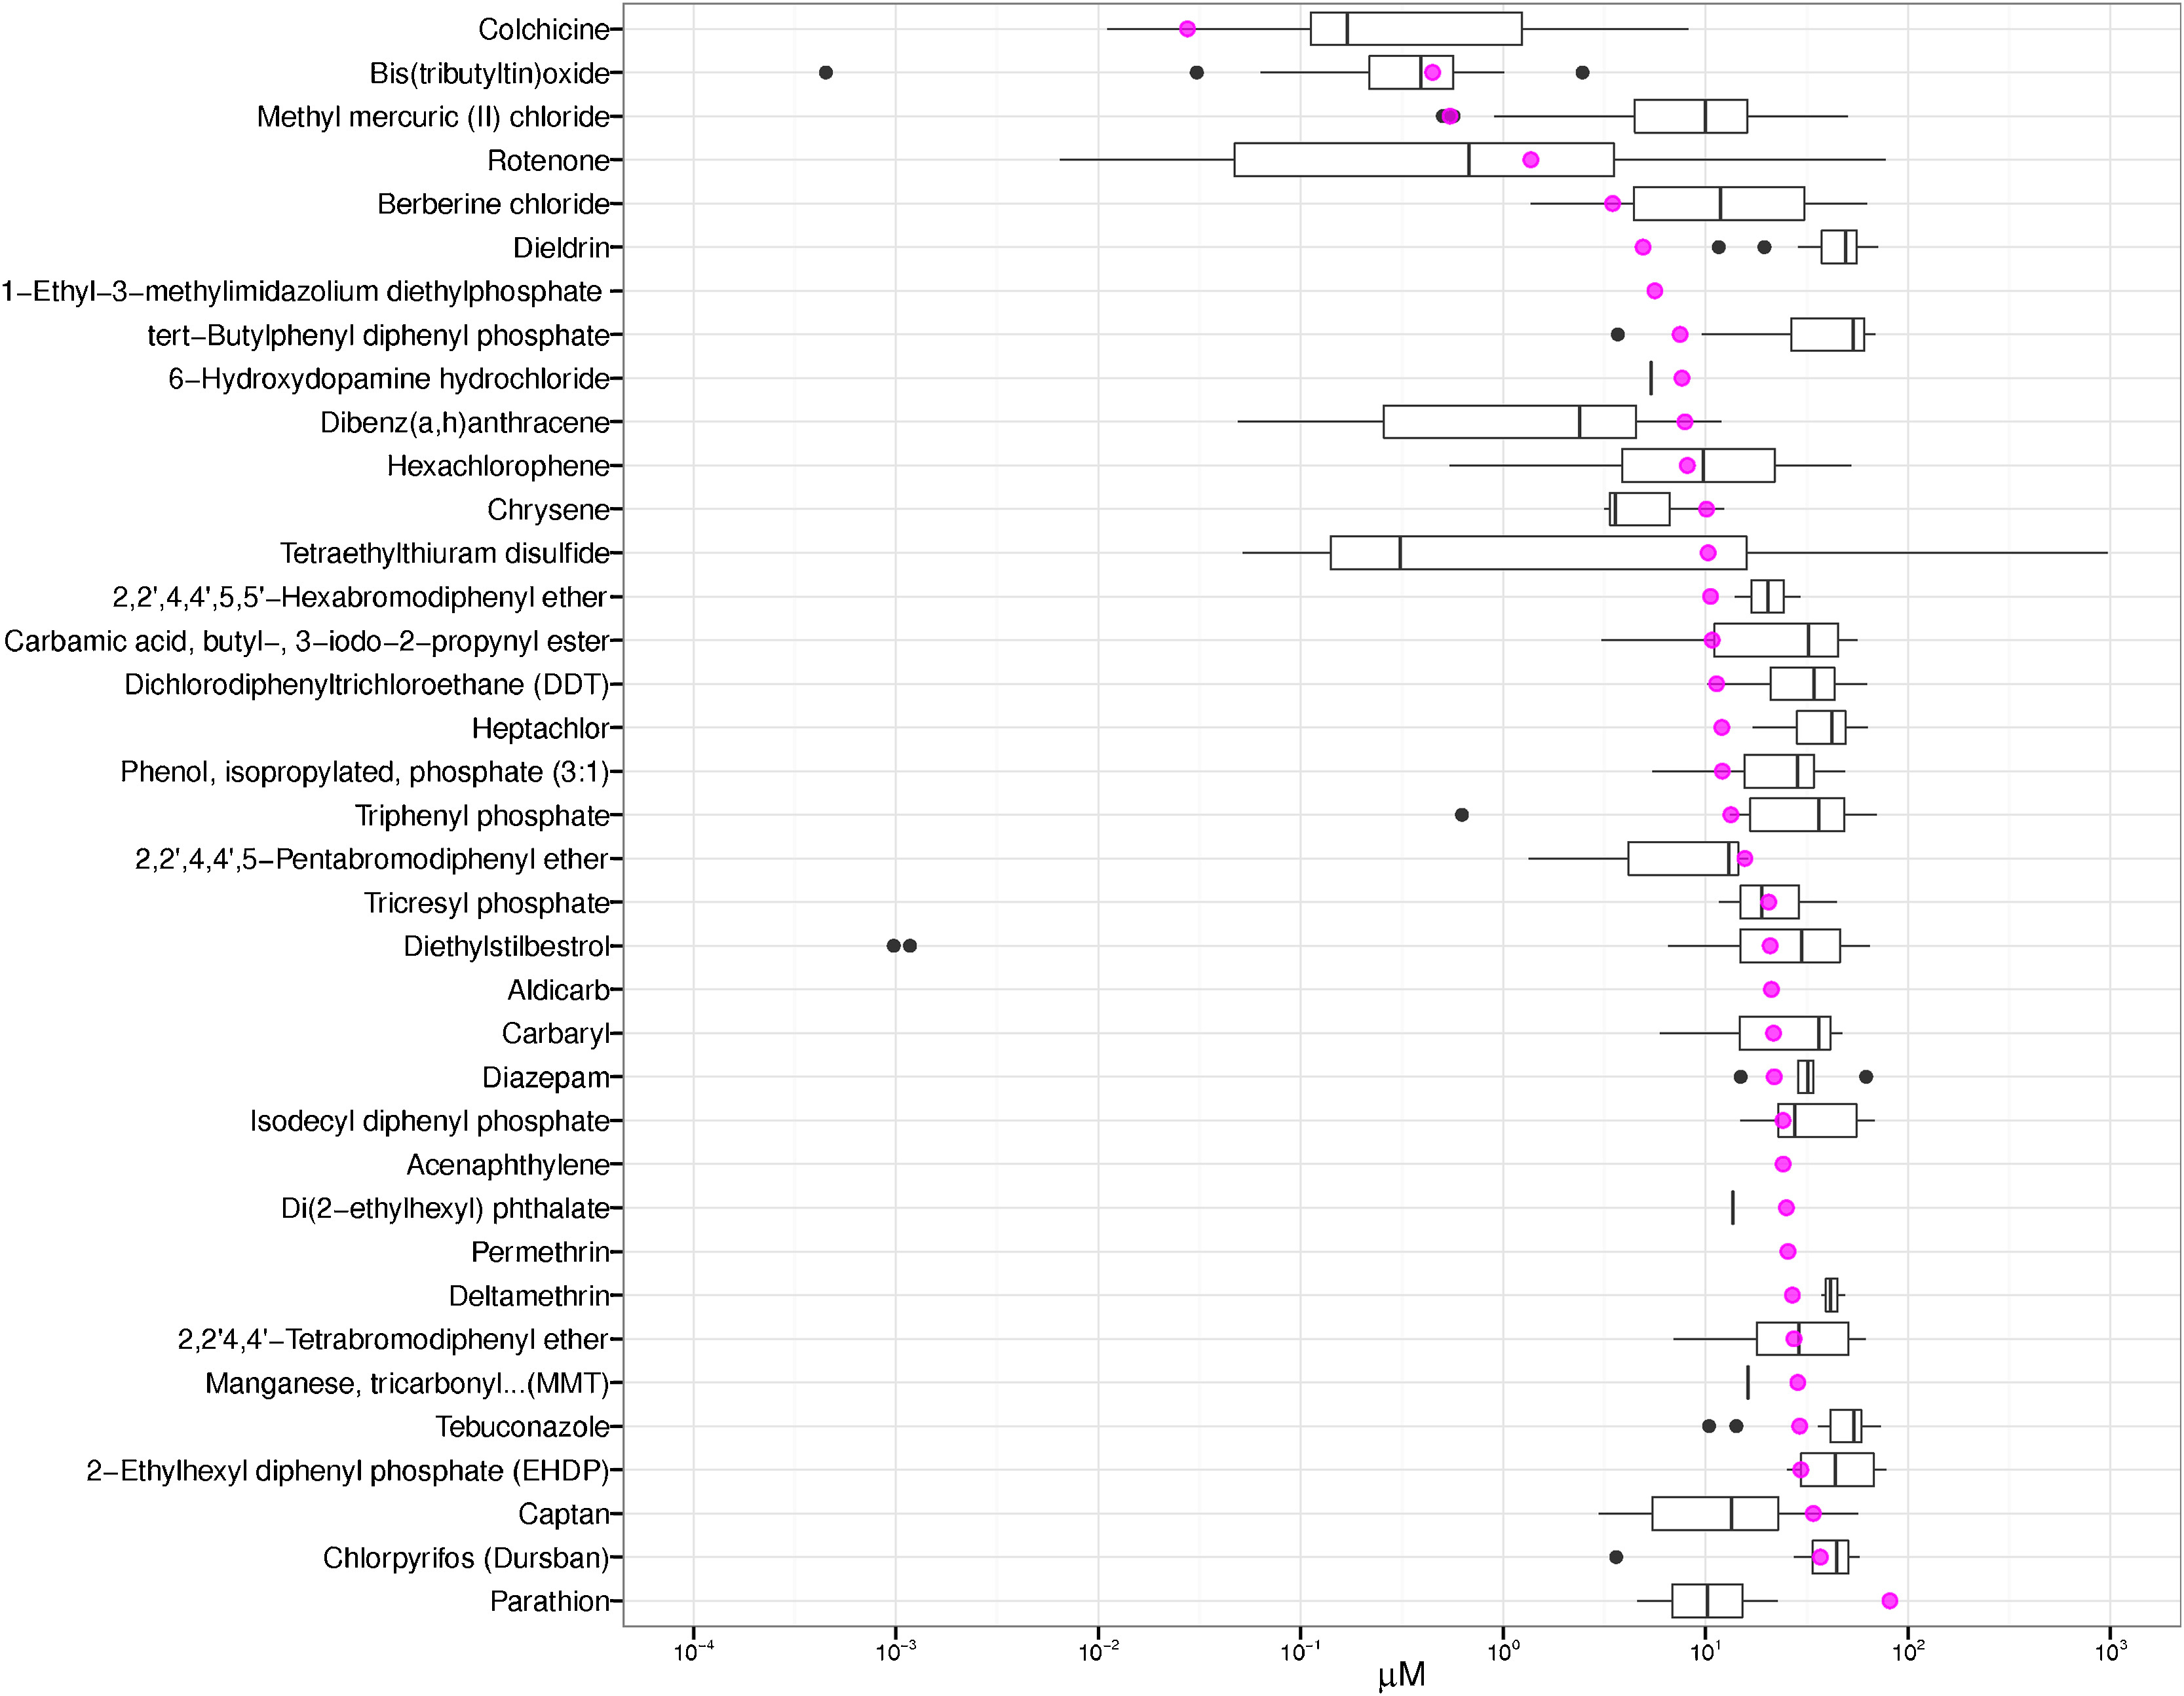
Figure 6. The comparison of active potency between the neurite outgrowth assay and Tox21 assays.
The actives in the neurite outgrowth assay are ranked by the most potent (top) to the least (bottom) based on estimated BMC values (magenta ●) from the most sensitive neurite endpoint. For each compound, the potency distribution of actives in Tox21 assays is overlaid as a box plot: The band inside the box represents the median values for Tox21 actives.
- Figure 6 (755 KB)
Tables
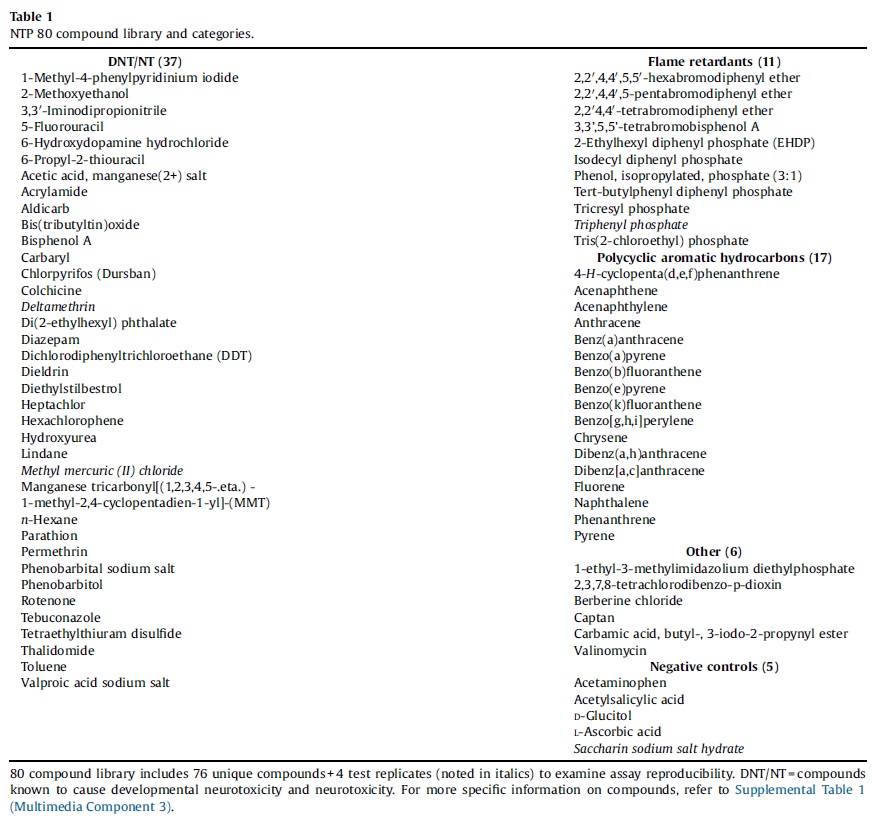
Table 1. NTP 80 compound library and categories.
80 compound library includes 76 unique compounds + 4 test replicates (noted in italics) to examine assay reproducibility. DNT/NT = compounds known to cause developmental neurotoxicity and neurotoxicity. For more specific information on compounds, refer to Supplemental Table 1.
- Table 1 (214 KB)
Supplemental Materials
Supplemental Data
- Multimedia Component 1: Supplemental Figs. 1 , 2 and 3 (3 MB)
- Multimedia Component 2: Supplemental Materials and Methods (34 KB)
- Multimedia Component 3: Supplemental Table 1 (31 KB)
- Multimedia Component 4: Supplemental Table 2 (108 KB)
- Multimedia Component 5: Supplemental Table 3 (42 KB)
- Multimedia Component 6: Supplemental Table 4 (115 KB)
- Multimedia Component 7: Supplemental Table 5 (41 KB)